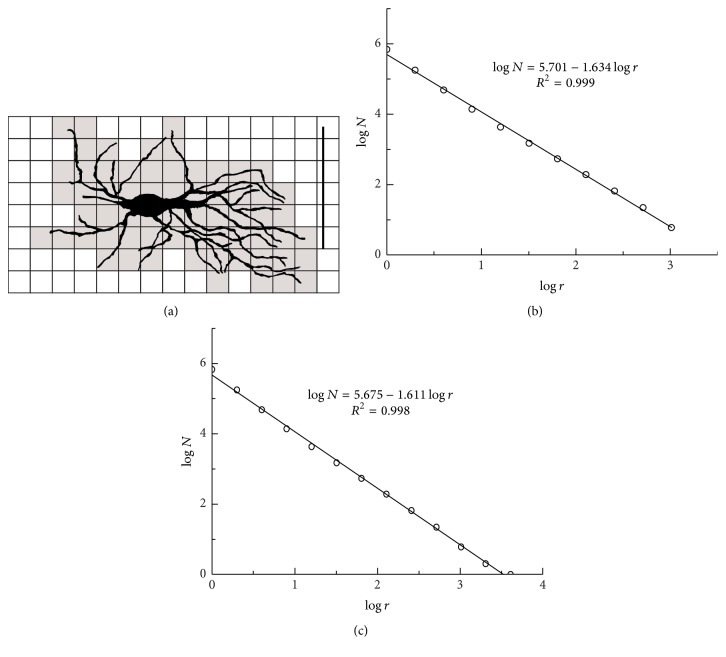
Figure 2.
Application of the box-counting method to 2D image of type 1 neuron from the monkey dentate nucleus: (a) the whole image is covered with a set of squares and squares which cover dendrites are counted. (b) Log-log plot between numbers of squares (N) and square size (r) is fitted by a straight line. The square sizes (r) are taken by geometric progression. (c) Modification of square sizes (from 1 to 4096 pixels) illustrates interval of scaling and accurate BD. The linear equation between logN and logr is shown in upper part of graphs, where DB is the absolute value of the slope and R is the corresponding correlation coefficient.

