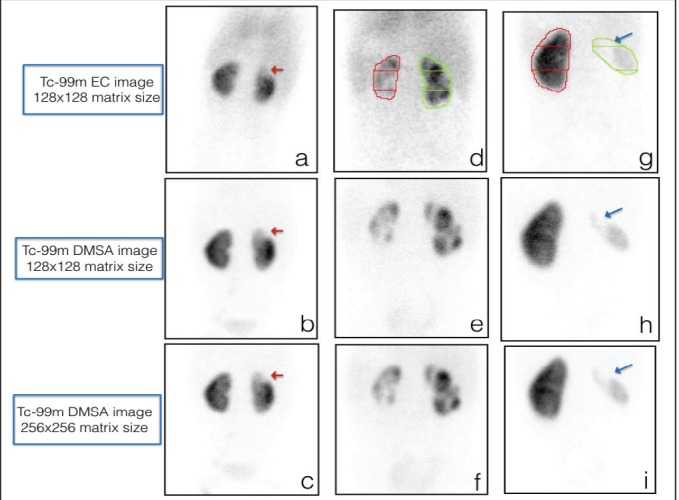
Figure 2.

Comparison of scars using Tc-99m EC, Tc-99m DMSA 128 × 128 image matrix size, and Tc-99m DMSA 256 × 256 image matrix size: ≤ 50% scar at the upper pole of the right kidney (a, b, c red arrow), detection of multiple ≤50% and >50% size scars bilaterally (d, e, f), and identification of large scar involving entire right kidney (g, h, i blue arrow)
