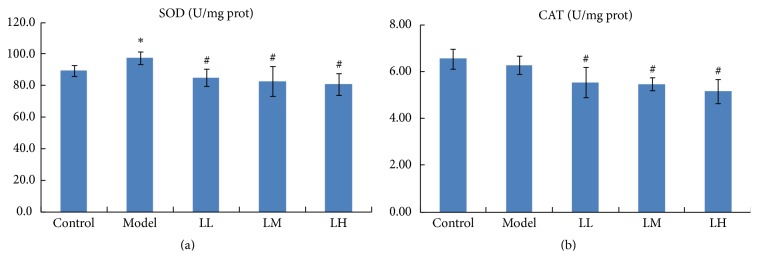
Figure 4.
Effects of lemon juice on the activities of SOD (a) and CAT (b) in liver. Control: normal group; Model: alcohol group; LL: alcohol and low dose of lemon juice group; LM: alcohol and medium dose of lemon juice group; LH: alcohol and high dose of lemon juice group. ∗ means the levels of the parameters in the model group were significantly (p < 0.05) different from those of the control group. # means the levels of the parameters in the treatment group were significantly (p < 0.05) different from those of the model group.

