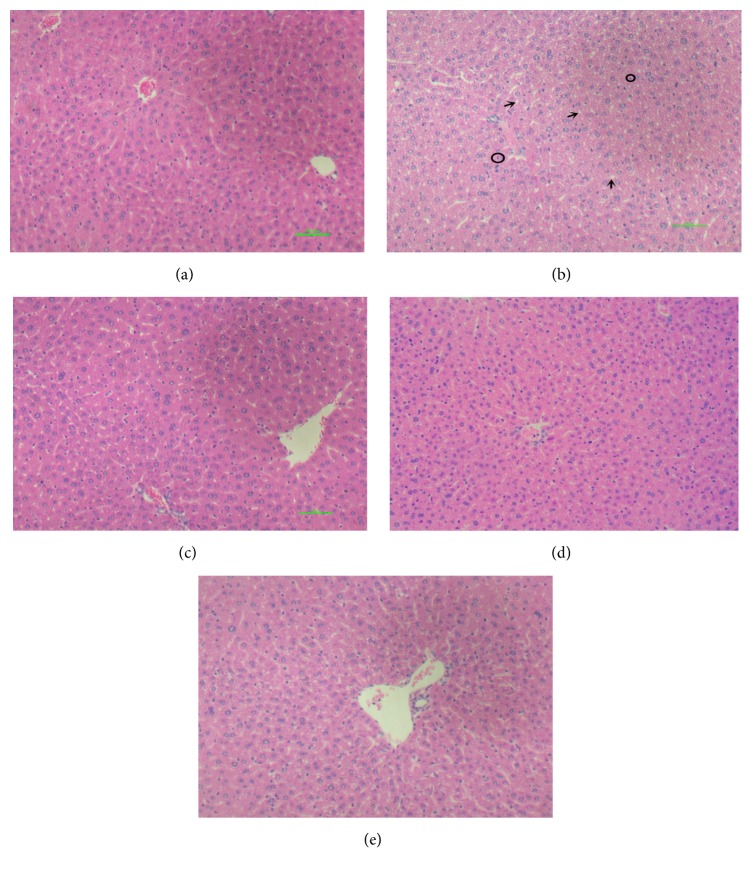
Figure 5.
The photomicrographs of liver sections taken from mice. (a) Normal group; (b) alcohol group; (c) alcohol and low dose of lemon juice group; (d) alcohol and medium dose of lemon juice group; (e) alcohol and high dose of lemon juice group. Arrow indicates a condition of small fat droplets changes, and the circle indicates hepatocytes necrosis, which mainly occurs in alcohol model group.

