
Figure 2. Genes differentially expressed across EP clusters highlight novel markers and potential functional differences.
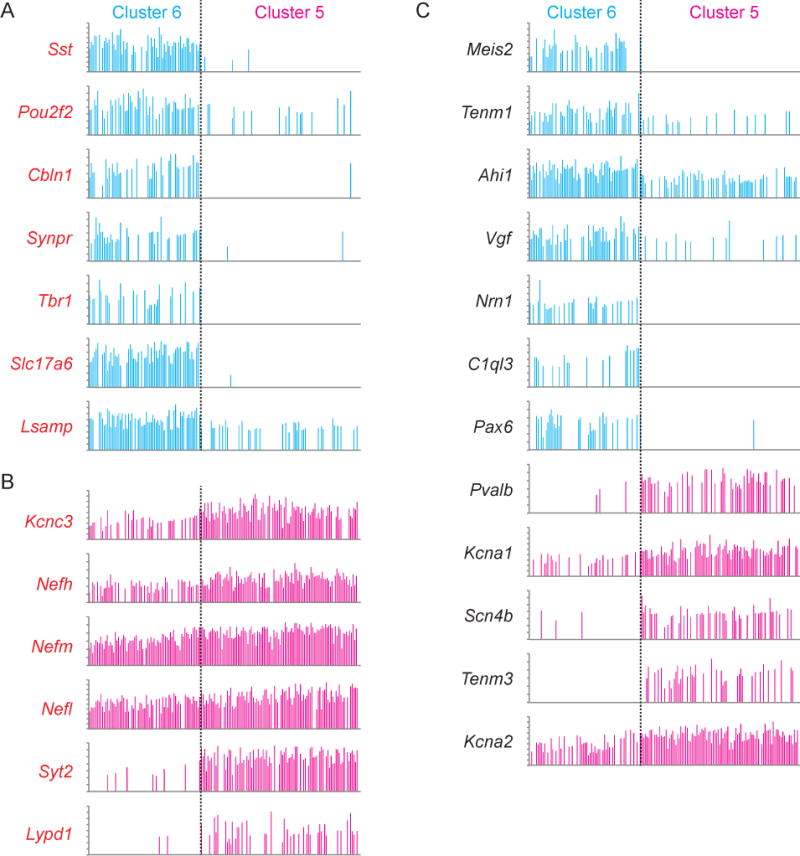
A, B. Genes enriched in cluster 6 (A, blue) or cluster 5 (B, magenta) as compared to the whole population of neurons. Each bar represents the expression level of the indicated gene for a single EP neuron (total number of cells n = 166). The y-axis is log2 normalized expression level for each gene (maxima range from 2.5–5.34). Genes in red indicate genes that are also significantly different across clusters 5 vs 6.
C. Genes not listed in panels A and B that are differentially expressed across clusters 5 and 6. Blue bars represent genes that are enriched in cluster 6 and magenta bars represent genes that are enriched in cluster 5. See also Figure S2.