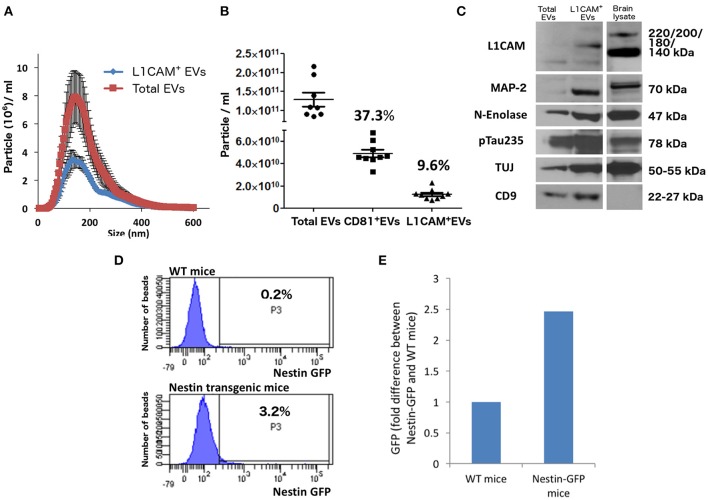
Figure 2.
Neuronal EVs are found in the circulation. (A) Total EVs and L1CAM+ EVs were isolated from plasma of nine healthy volunteers and their size distribution was examined by NTA using Nanosight-NS500. Figure depicts concentration after 1:1,000 dilution for Total EVs and 1:200 dilution for L1CAM+ EVs; actual concentrations are depicted in (B). (B) The graph shows the actual concentration of total EVs and L1CAM+ and CD81+ plasma EVs immunoprecipitated from plasma of nine healthy volunteers after adjusting for dilution. The percentages in the graph represent the ratio over total EVs. (C) Western blot image shows enrichment of neuronal markers (L1CAM, MAP-2, N-enolase, p-Tau235, and TUJ) in L1CAM+ EVs when compared to total EVs from a single healthy control. CD9 is a common exosomal marker present in EVs but not in the mouse brain lysate used as a positive control. An equivalent amount of EVs was loaded on the gel by adjusting the dilution of the isolates according to the EV concentration determined by NTA. (D) GFP levels evaluated by FACS; L1CAM+ EVs were isolated from 300 μl plasma derived from Nestin-GFP transgenic or WT mice. The EVs were conjugated with the beads and the levels of GFP were evaluated by FACS analysis. The results show the percentages of beads-antibody-EV complex that contained GFP above the detection threshold. (E) GFP levels evaluated by fluorescence; comparison between the levels of GFP in EVs in the samples described in (D) were measured by plate reader at excitation of 485 nm and emission 515 nm.

