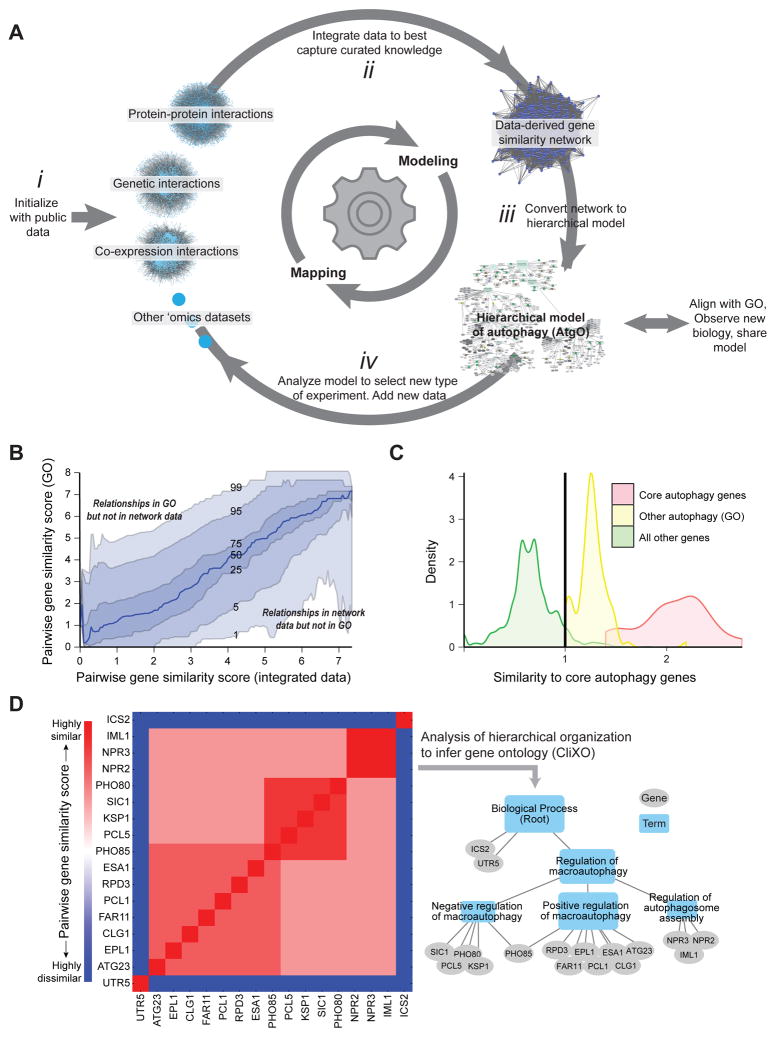
Figure 1. Program for Active Interaction Mapping.
(A) After initialization with public data sets (i), the approach proceeds by progressive iterations of data integration (ii), hierarchical model assembly (iii), and adaptive generation of new data (iv). (B) Pairwise gene similarity scores from curated knowledge (GO) versus the integrated data. Curves track percentiles in GO similarity scores at a given level of data similarity. (C) Selection of 492 autophagy-related genes. Twenty genes (red) are assigned to “core autophagy” by (Jin and Klionsky, 2013); another 102 genes (yellow) are annotated to GO:autophagy (GO:0006914). For all other genes (green) the average similarity score to core autophagy genes is calculated from the network data; a similarity threshold (vertical line) is set to select 370 genes at least as similar to core genes as those in GO:autophagy. (D) Inference of the hierarchical model from (idealized) pairwise similarity scores using CliXO.

