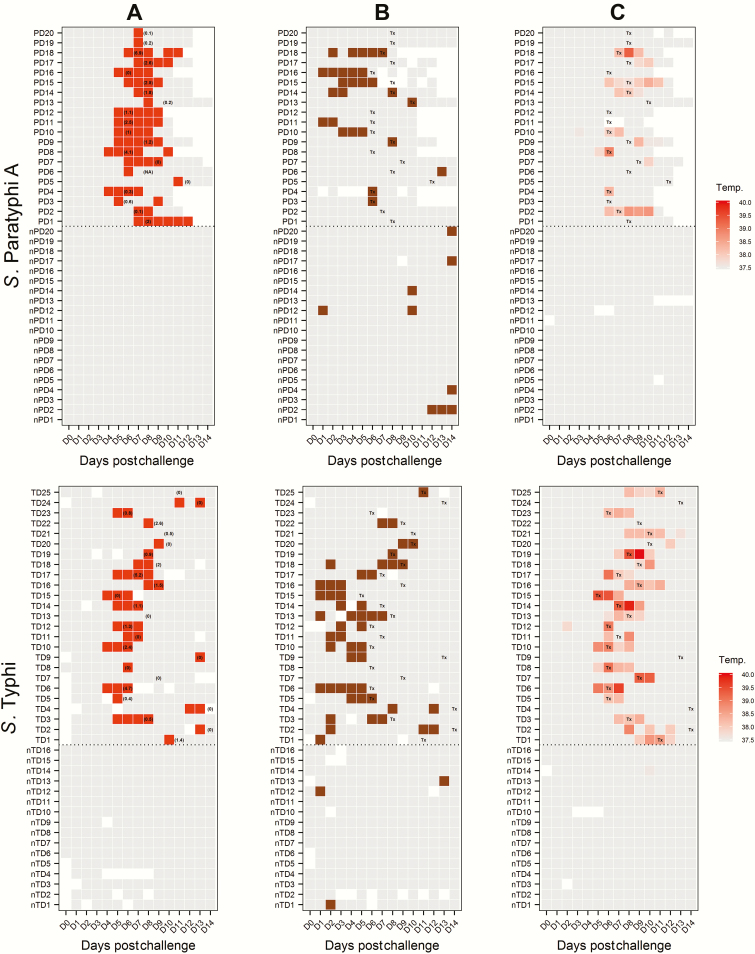
Figure 3.
Clinical and microbiological dynamics for participants challenged with Salmonella Typhi and Salmonella Paratyphi A. A, Pattern of blood culture results (red, positive; gray, negative; white, sample not collected). Numbers in parentheses refer to quantitative blood culture colony count (colony-forming units/mL) taken immediately prior to antibiotic treatment and correspond to day of treatment initiation. B, Pattern of stool shedding following challenge. Colored squares indicate stool culture results for S. Paratyphi A or S. Typhi (brown, positive; gray, negative; white, sample not collected). C, Maximum temperature (temp., °C) measurements by day. Abbreviations: day 0, day of challenge; nPD1–20, paratyphoid disease not diagnosed; nTD1–16, typhoid disease not diagnosed; PD1–20, confirmed paratyphoid disease; TD1–25, confirmed typhoid disease; Tx, day of treatment initiation.

