
Fig. 4.
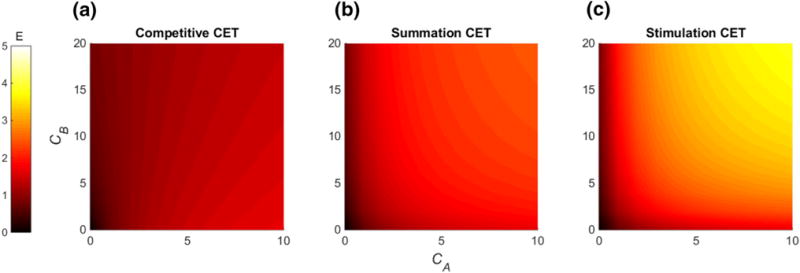
Heat maps visualizing the effect of the competitive (EmaxAB = 2) Eq. (18), summation (EmaxAB = 3) Eq. (39), and stimulation (EmaxAB = 5) Eq. (43) CET are shown. Brighter color denotes a higher combination effect. The single maximal effects were set to EmaxA = 2 and EmaxB = 1 (Color figure online)