
Fig. 5.
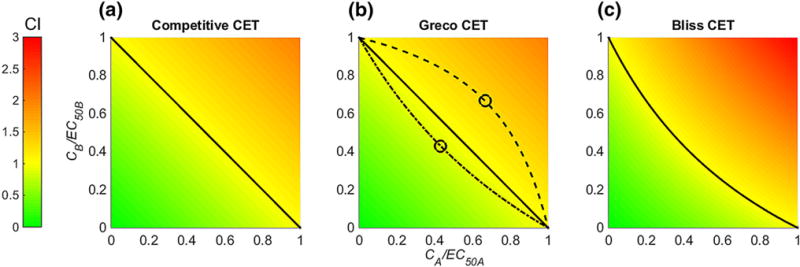
For the competitive (a) Eq. (18), Greco (b) Eq. (37) and Bliss Eq. (33) (c) CET optimal concentration pairs from Loewe Additivity (a, b) and Bliss Independence (c) are indicated (solid black line and yellow area). Green surface denotes area of synergism and red surface is area of antagonism. Additionally, for the Greco CET (b) half-maximal effect curves for α = 0.75 (dashed dotted line) and α = −0.75 (dashed line) are shown, and the corresponding unique optimal concentration pair is indicated (circles) (Color figure online)