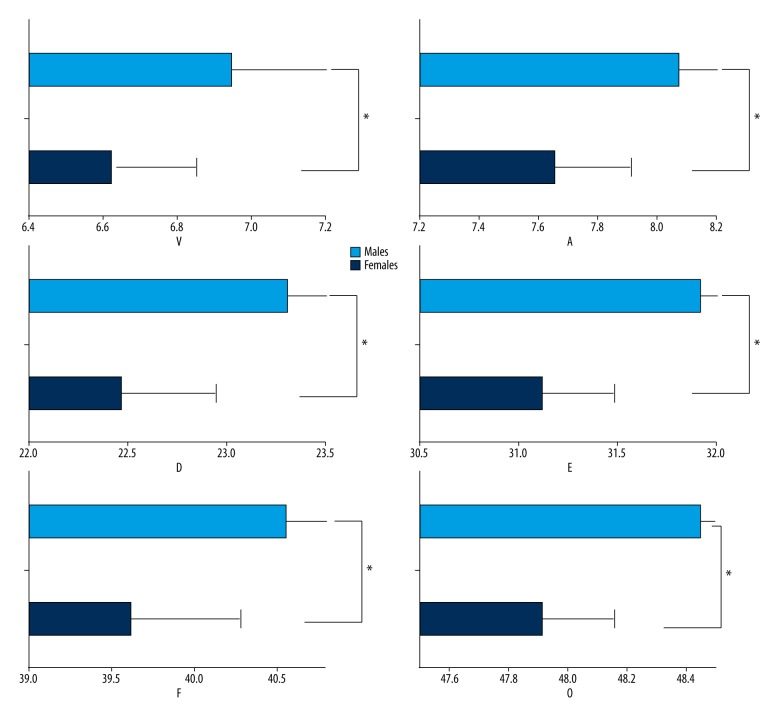
Figure 2.
The mean latencies of the 6 peaks of the speech-ABR are shown, with error bars representing+1 standard deviation of the mean. From these plots, it is clear that significantly longer latencies were observed for peaks V, A, D, E, F, and O in the young men compared with the young women (P<0.05). The asterisk (*) indicates a statistically significant difference (P<0.05).

