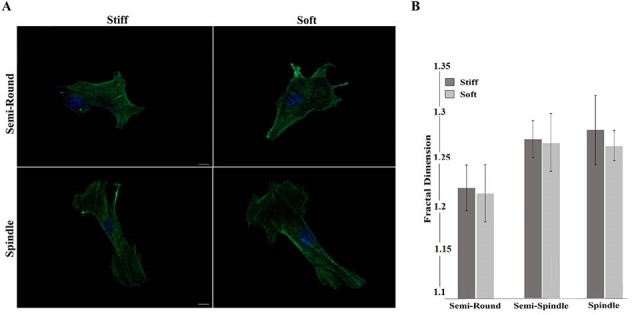
Fig. 3.

Quantitative and qualitative presentation of the actin fibers arrangement 24 h after seeding on stiff and soft substrates A) Fluorescent images, And B) Fractal dimension calculation of actin structure. As the images show, there is no statistical difference among the clusters in each group (Scale bar: 5 µm).
