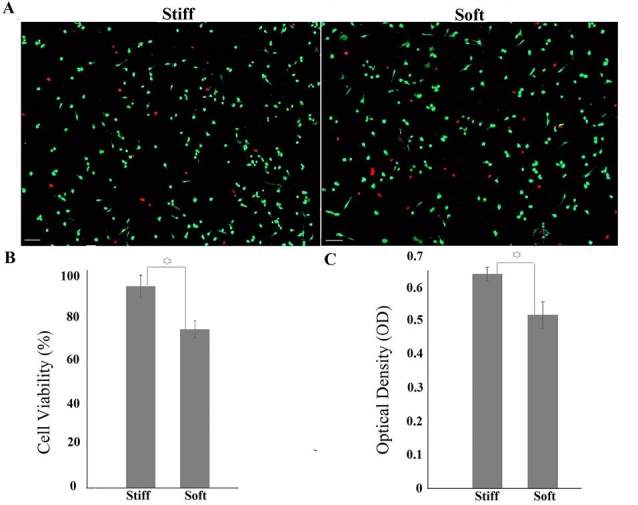
Fig. 5.

A, B) Cell viability on stiff and soft substrates after 24 h of culture. Red points represent dead cells (Scale bar: 200 µm). C) Metabolic activity of cells measured by MTT assay. OD number has direct relation to metabolic activity. Increased elastic modulus enhanced metabolic activity of cells. The star sign shows significant difference between two groups.
