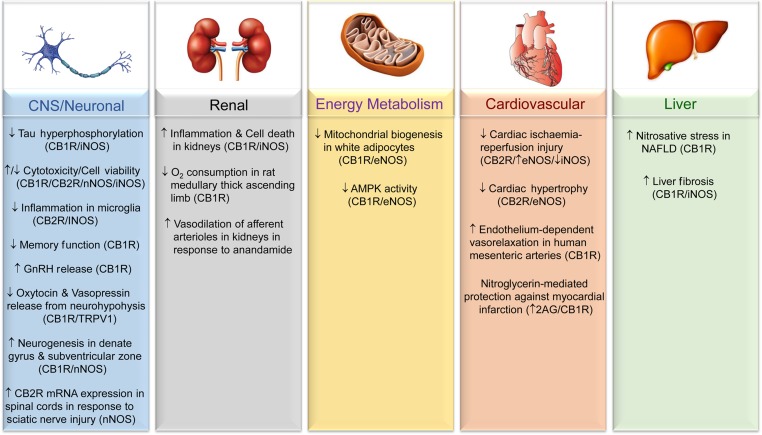
Figure 3.
Involvement of the ECS–NO• signalling axis in disease development and/or treatment. Schematic outlines the reported involvement of ECS–NO• signalling in the tissues/processes presented. The participation of different ECS components (i.e. CB1R, CB2R, or TRPV1) is inferred from the use of selective agonists and/or through genetic or pharmacological inhibition, and is presented in brackets if known. Also included are details of the specific NOS isoform(s) involved in mediating the indicated response if determined. Arrows denote an inferred induction (↑) or repression/alleviation (↓) of the indicated process/pathology in response to activation of the specified ECS component.

