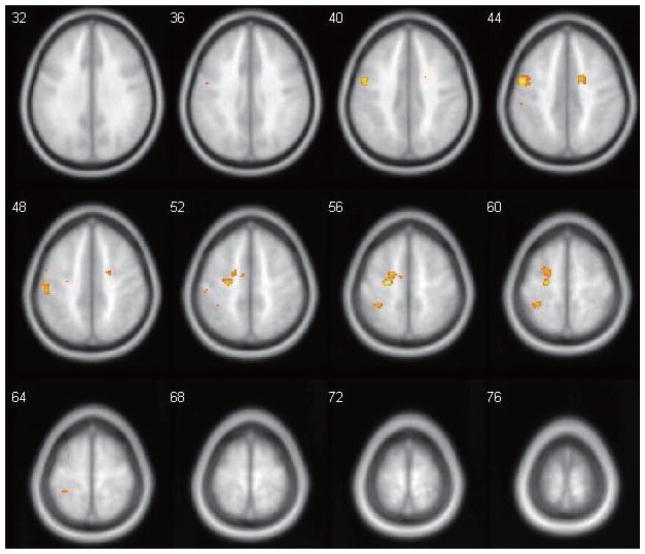
Fig. 2.
Between-group comparison (TD > TBI) of inhibition-related activation. Positive activation regions are where TD controls demonstrated greater activation than TBI (TD > TBI). Images are from z = +32 to z = +76, with the same threshold parameters as in Fig. 1. (Colours are visible in the online version of the article; http://dx.doi.org/10.3233/PRM-150350)

