
Figure 1.
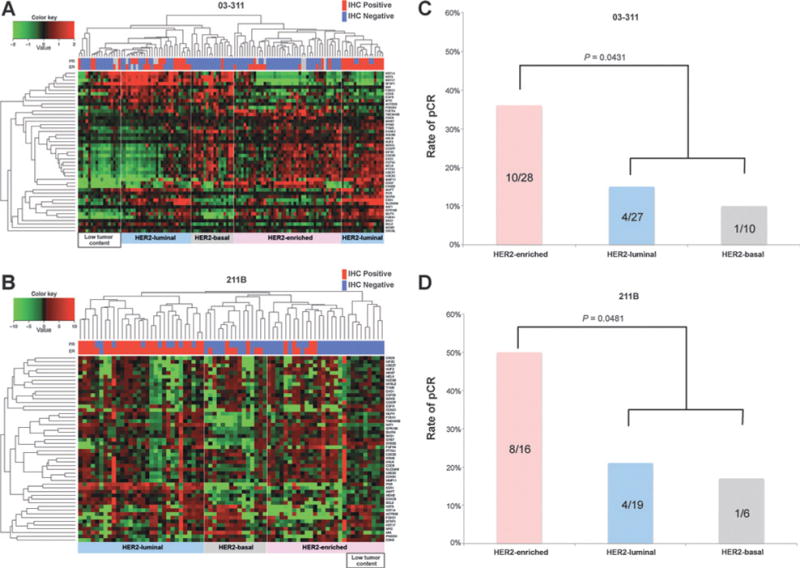
PAM50 subtyping. A, hierarchical clustering of microarray samples from the 03-311 cohort using the PAM50 genes. Three major clusters were identified, including Luminal, HER2-Basal, and HER2-enriched subtypes that correspond well with ER/PR IHC and the expression levels of proliferation genes. B, hierarchical clustering of samples from the 211B trial using targeted RNA sequencing of the PAM50 genes. Samples that showed poor expression of a majority of genes were considered to have low tumor content. C, rates of pCR across PAM50 subtypes in 03-311 cohort. Shown are the percentages of pCR within each subtype. Significance of the rate of pCR in the HER2-enriched subtype as compared with the remaining tumors was assessed using a two-sided Fisher exact test. D, rates of pCR across PAM50 subtypes in 211B cohort. Shown are the percentages of pCR within each subtype. The hypothesis that the HER2-enriched subtype exhibited the highest rate of pCR as compared with the rest was evaluated using a one-sided Fisher exact test.