
Figure 4.
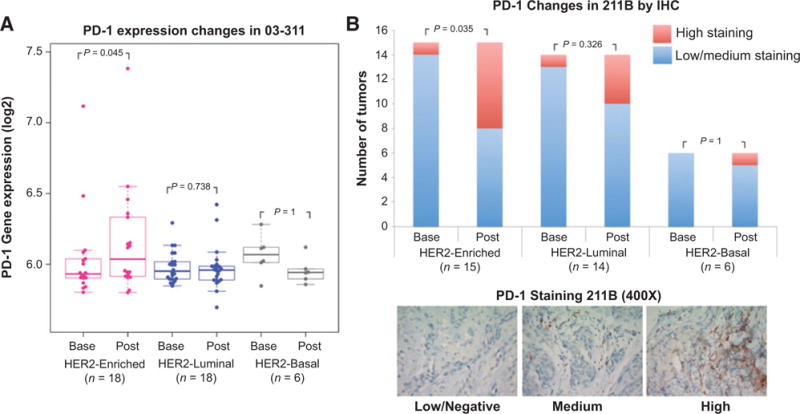
Modulation of PD-1 expression upon brief exposure to trastuzumab. A, plotted are the normalized log2 expression levels of PD1 in the 03-311 trial at baseline and post brief exposure to trastuzumab across the three PAM50 subtypes. The ladder plots indicate changes in expression in matched baseline and postexposure biopsy samples. Significance was assessed using a paired one-sided Wilcoxon test evaluating for increase in PD1 expression upon brief exposure to trastuzumab. B, the bar graphs plotted on top represent the number of tumors with low/medium (blue) or high (red) PD-1 protein expression by IHC at baseline and post brief exposure to trastuzumab across subtypes in the 211B trial. Significance was assessed using a Fisher exact test. Representative IHC stains of PD1 in the 211B trial in the low/negative, medium, and high categories at shown at 400× magnification in the bottom.