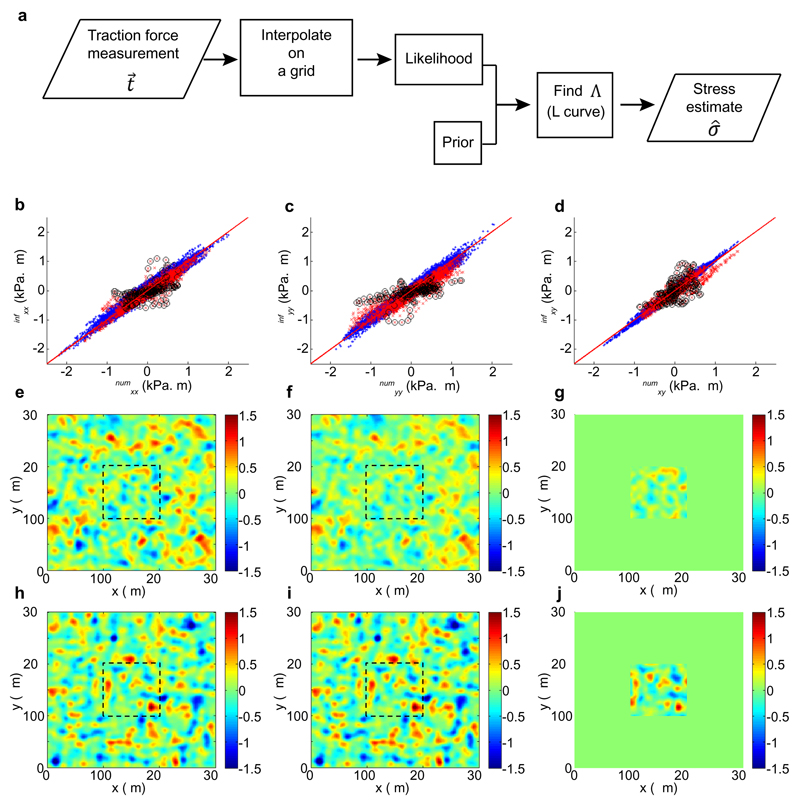
Extended Data Figure 8. Bayesian Inference Stress Method (BISM) and robustness study.
a, Schematic of inference algorithm. b-d, Plots of inferred stress vs. simulated stress for each component, in kPa.μm. Red line is bisector y = x. Blue dots: 3N×3N stress, σwhole for the whole system, Red dots: N×N stress, σcentral for the central region, Black circles: stresses obtained less than 2 μm from the boundary of the central region. e-g, Pressure and h-j, shear stress fields in kPa.μm: from left to right exact values, σnum, inferred values obtained for whole monolayer, σwhole and inferred values obtained for central part, σcentral. Black dashed box represents the central region within the whole tissue.

