
Figure 3.
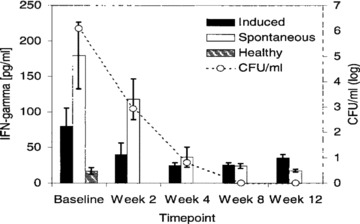
Correlation between IFN‐γ levels and mycobacterial load in sputum from TB patients during the first 12 weeks of anti‐Mtb treatment. Duplicate aliquots of spontaneous and induced sputum from TB patients (n= f 5) were used for assessment of IFN‐7 levels by ELISA and quantitative mycobacterial culture. Results are expressed as picograms of IFN‐7/mL (left v axis) and log CFU (CFU, right y axis). Sputum IFN‐7 levels from healthy PPD‐positive controls (n= 10) are included for comparison. Cytokine data are presented as mean ± SEM. ▪= induced sputum from TB patients; D= spontaneous sputum from TB patients; on= induced sputum from healthy controls. Reprinted from Reference 25 with permission.