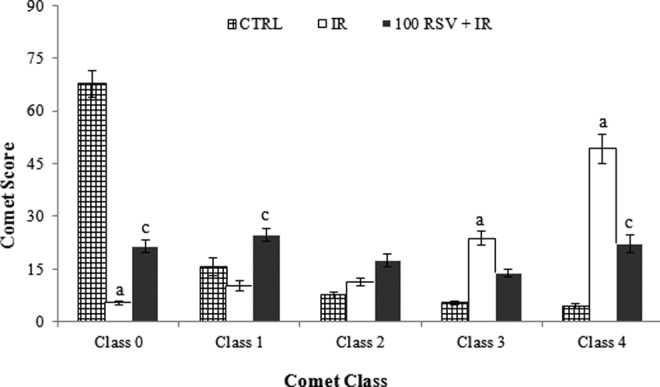
Figure 1.

Mean frequency of every comet class per 100 cells (±SE) result in comet assay with RSV for study groups. a P < .001 comparison of group 3 with group 1. b P < .001 comparison of group 4 with group 2. c P < .001 comparison of groups 7 and 8 with group 3. RSV indicates resveratrol; SE, standard error.
