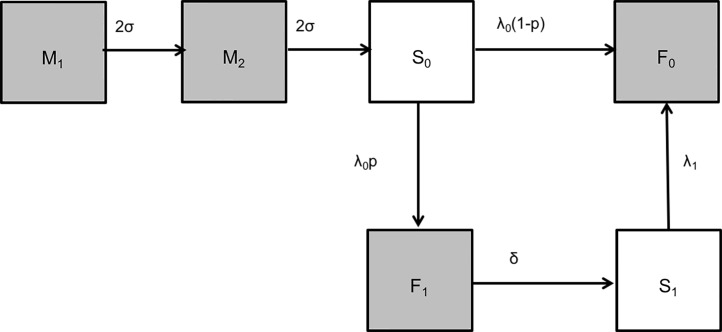
Fig 2. The nested model structure for exploring age-prevalence data for RSV using catalytic infection models.
The compartments in the model represent the following states of the population: M = Individuals with maternally acquired antibodies (split into 2, M1 and M2 to allow for improved fit), S0 = Seronegative after loss of maternally acquired antibodies, F0 = Permanent seropositive status after infection, F1 = Temporary seropositive status after primary infection, S1 = Seronegative after loss of infection acquired antibodies. When p = 0, the model reduces to MSF, when p = 1 and only 1 rate of infection is estimated (λ0 = λ1) the model is MSFSF1 and with p = 1 and 2 rates of infection estimated (λ0 ≠ λ1) the model is MSFSF2.

