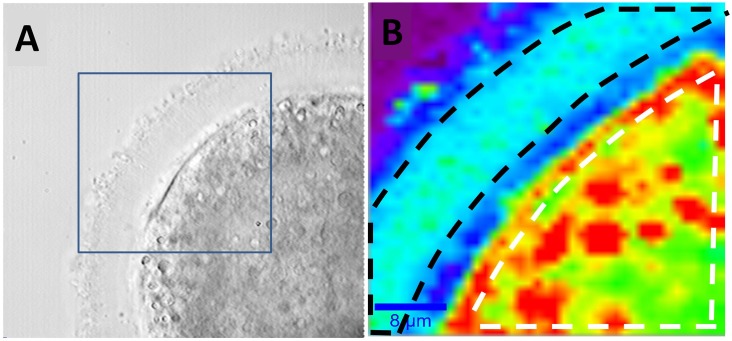
Fig 1.
A) Bright field image of an oocyte from the control group. The blue square highlights the region analysed by Raman analysis. B) Raman image obtained via Raman imaging. The white dashed line defines the oocyte area used for the calculation of the average spectrum of the cytoplasm region, while the black dashed line borders the region used for the ZP region.

