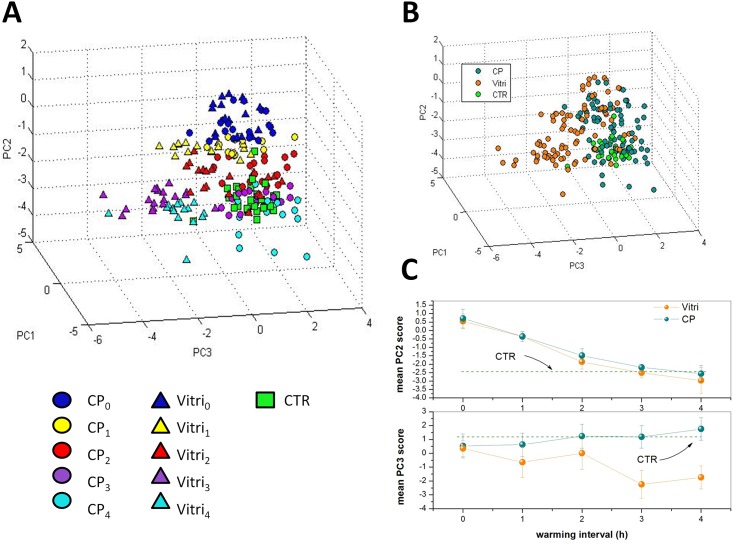
Fig 5.
A) Score plot relative to the PC analysis of the oocytes cytoplasm, as specified in Table 1.The symbols corresponding to CPi and VITRIi are dots and triangles, respectively, while spectra corresponding to the control group are represented by squares. For both CP and VITRI groups, the different colours indicate the different warming intervals before cells fixation. B) Same score plot as in part a) but with points corresponding to the same CPi and VITRIi group (i = 1-4) represented by the same symbol. C) Mean PC2 and PC3 scores for all the groups analyzed herein. The bars indicated represent the standard deviations obtained for each group.

