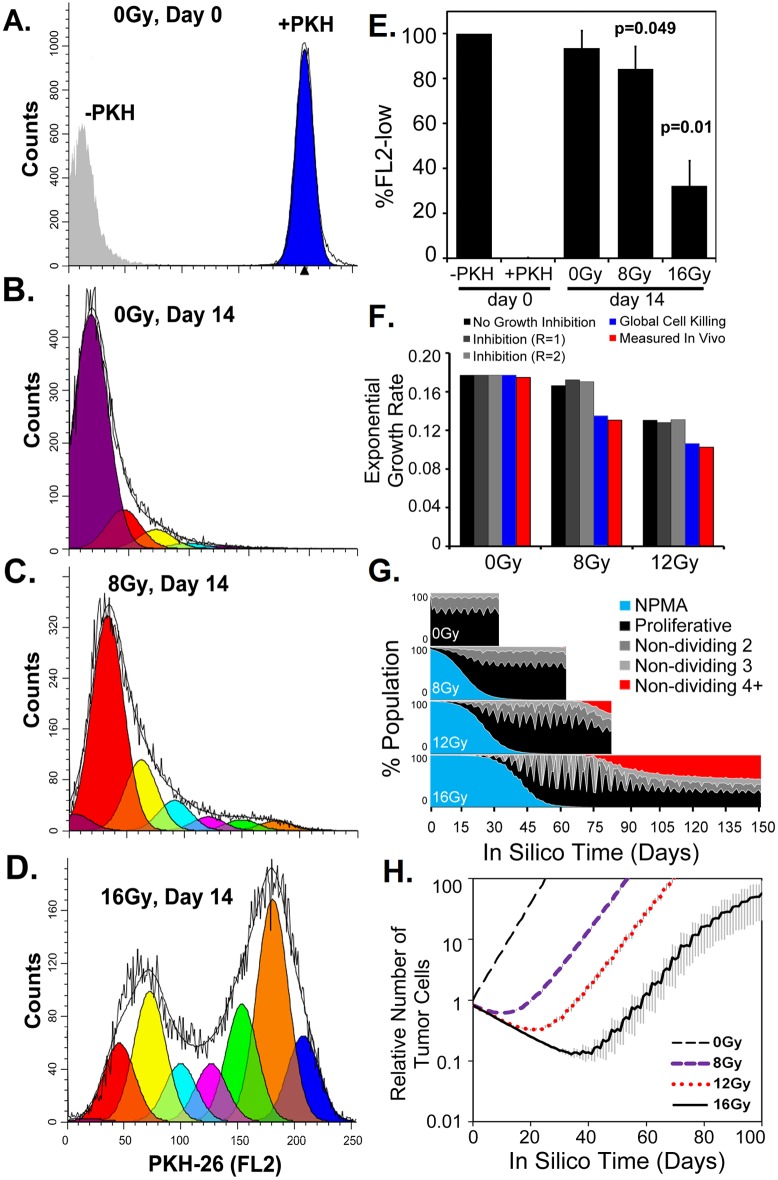
Fig 5. Tracking cell divisions post-irradiation for the cellular automaton computational modeling.
(A-D.) Representative flow cytometry analysis of the number of cellular divisions after irradiation in the in vitro colony formation assay. Using the ModFit LT3.2 software, raw data (black lines) were fit and modeled for proliferation that results in decreased PKH-26 fluorescent intensity. The number of divisions (1 = orange, 2 = green, 3 = pink, etc.) from the (A) initial untreated day 0 cells with PKH-26 stain (blue) or without (grey) were measured at day 14 following (B.) 0Gy, (C.) 8Gy or (D.) 16Gy irradiation. (E.) Quantification of cells maintaining reproductive integrity were measured as cells undergoing two or more cellular divisions thus decreasing the PKH-26 fluorescent intensity (FL2-low). N = 3, SD is shown, p-values were compared to 0Gy day 14. (C.) Exponential growth rates measured in 10 independent simulations for inhibitory conditions compared to in vivo observations. (D.) Cellular tracking in silico of NPMA or proliferative cells. The proliferative population was also divided by monitoring those cells that have not divided for 2, 3 or 4 or more time steps. (E.) Cell growth in silico recapitulates the observed tumor growth rates. N = 3, SD is shown.

