Figure 8.
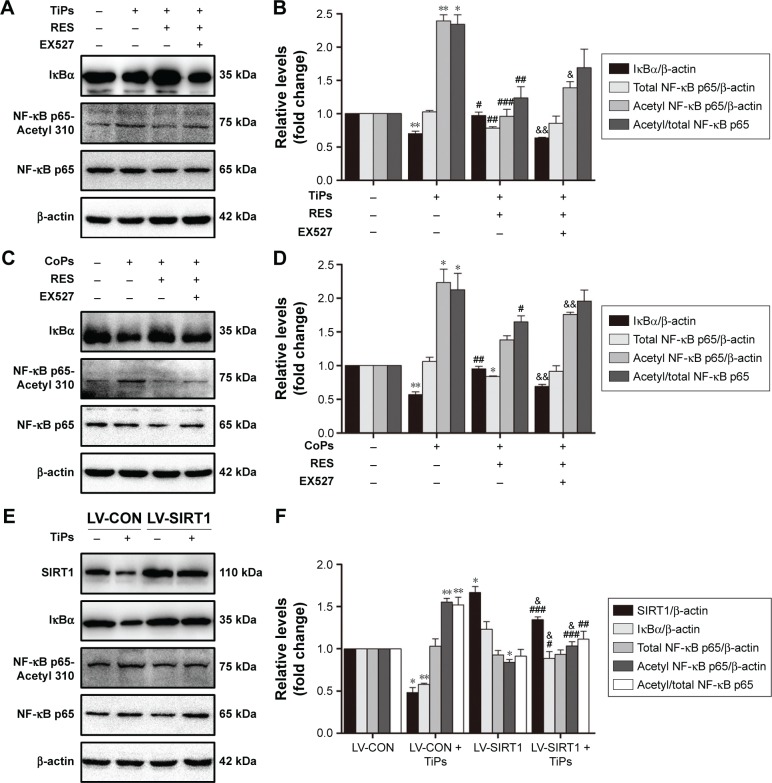
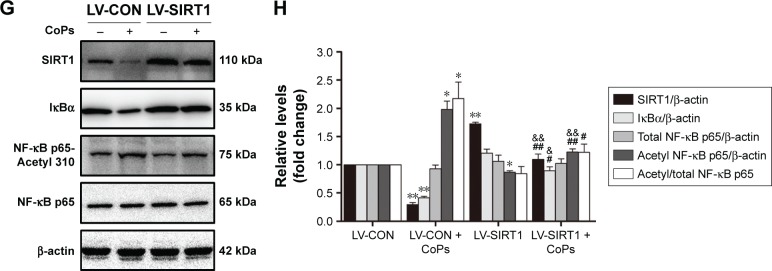
The SIRT1–NF-κB pathway was involved in the inflammation responses induced by metal nanoparticles.
Notes: (A) Western blots performed after Raw264.7 cells were treated with PBS (control), TiPs, TiPs + resveratrol, TiPs + resveratrol + EX527. (B) The density of the Western blot bands in (A) was quantified using Gene Tools software. *P<0.05; **P<0.01 versus control. #P<0.05, ##P<0.01, ###P<0.001 versus TiPs. &P<0.05, &&P<0.01 versus TiPs + resveratrol. (C) Western blots performed after Raw264.7 cells were treated with PBS (control), CoPs, CoPs + resveratrol, CoPs + resveratrol + EX527. (D) The density of the Western blot bands in (C) was quantified using the Gene Tools software. *P<0.05; **P<0.01 versus control. #P<0.05, ##P<0.01 versus CoPs. &&P<0.01 versus CoPs + resveratrol. (E) Western blots performed after control cells and SIRT1 overexpression cells were treated with TiPs. (F) The density of the Western blot bands in (E) was quantified using the Gene Tools software. *P<0.05, **P<0.01 versus LV-CON. #P<0.05, ##P<0.01, ###P<0.001 versus LV-CON + TiPs. &P<0.05 versus LV-SIRT1. (G) Western blots performed after control cells and SIRT1 overexpression cells were treated with CoPs. (H) The density of the Western blot bands in (G) was quantified using Gene Tools software. *P<0.05, **P<0.01 versus LV-CON. #P<0.05, ##P<0.01 versus LV-CON + CoPs. &P<0.05, &&P<0.01 versus LV-SIRT1. The data of all the experiments are represented as the mean ± SEM from three independent experiments.
Abbreviations: SIRT1, Sirtuin 1; NF-κB, nuclear factor kappa B; PBS, phosphate-buffered saline; TiPs, TiAl6V4 particles; CoPs, CoCrMo particles; SEM, standard error of the mean; IκB, inhibitor of κB; RES, resveratrol.


