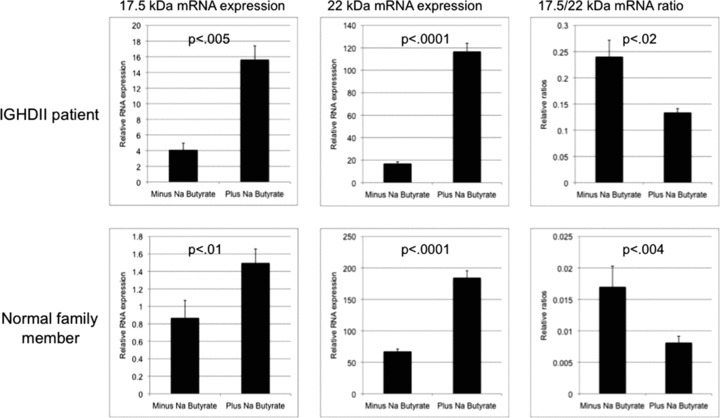
Figure 2.

Effect of 48‐hour exposure of 5 mm sodium butyrate on GH1 17.5‐kDa and 22‐kDa transcript levels and the 17.5‐/22‐kDa transcript ratios. Analysis was done with relative real‐time PCR in PBMNCs derived from an IGHD II patient and a first‐degree unaffected family member. Each sample was done in triplicate and analysis was repeated three times. Error bars represent SEM; p‐values were calculated by using student’s t‐test. Please note that scales of the graphs are slightly different for better visualization of differences between minus and plus samples.
