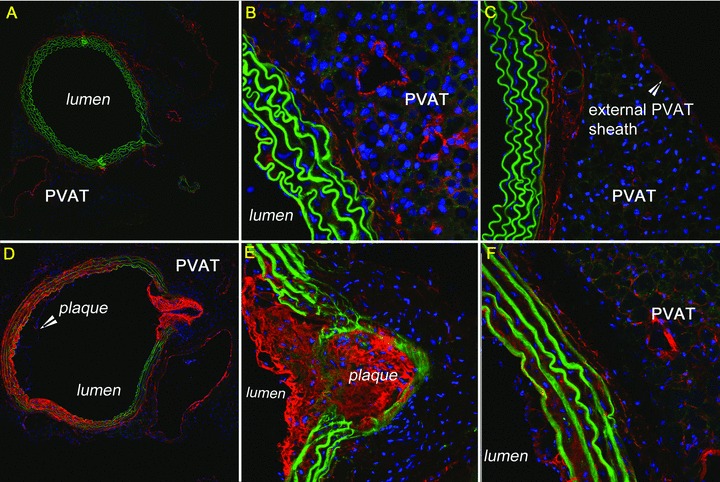
Figure 3.

Deposition of complement proteins throughout surrounding PVAT. A 36‐week‐old control: (A) C3 10×, red; (B) C3 40×, red; (C) C4 40×, red. A 36‐week‐old ApoE(−/−) with plaque and lumen disruption: (D) C3 10×, red; (E) C3 40×, red; (F) C4 40×, red. Green = auto‐fluorescing elastin. Blue = nuclear stain.
