Figure 2.

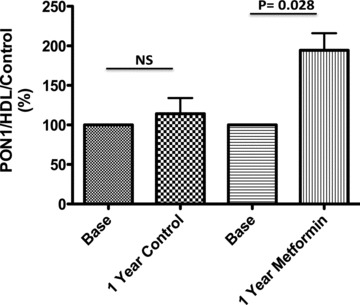
Analysis of the relation PON1 activity/HDL/Control values. In control and metformin group, each subject was normalized against basal values. Significant differences were observed base versus after 1 year of treatment with metformin.

Analysis of the relation PON1 activity/HDL/Control values. In control and metformin group, each subject was normalized against basal values. Significant differences were observed base versus after 1 year of treatment with metformin.