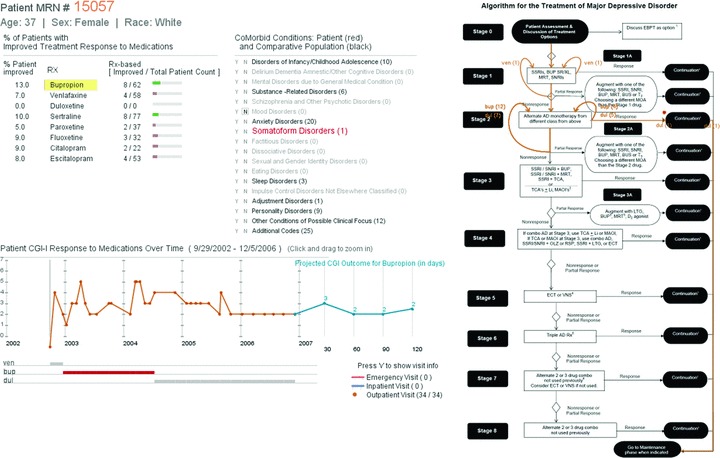
Figure 1.

Dashboard view of the visual analytics based clinical decision support tool: (1) Patient demographics, (2) Comparative response to medications, (3) Patient and comparative population comorbidities, (4) Guideline—patient visit view, (5) Temporal view of the patient response to treatment, (6) Projected response to selected medication, (7) Time duration of prescribed medication, and (8) Patient visit type information.
