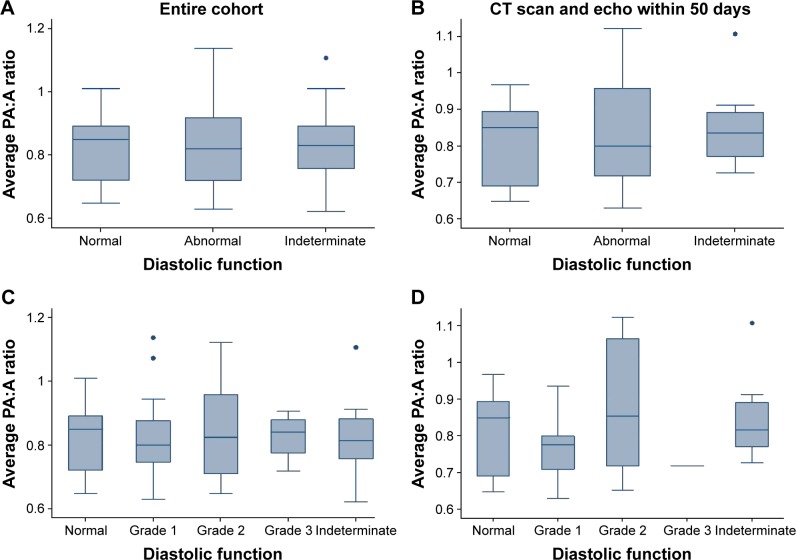
Figure 2.
The PA:A ratio across categories of diastolic dysfunction.
Notes: (A) The PA:A ratio compared across normal, abnormal, and indeterminate diastolic functions. (B) The PA:A ratio compared across normal, abnormal, and indeterminate diastolic functions in the subgroup of patients with CT scan and echocardiogram within 50 days of each other. (C) The PA:A ratio compared across severity of diastolic dysfunction. (D) The PA:A ratio compared across severity of diastolic dysfunction in the subgroup of patients with CT scan and echocardiogram within 50 days of each other.
Abbreviations: CT, computed tomography; echo, echocardiogram; PA:A, pulmonary artery: aorta.

