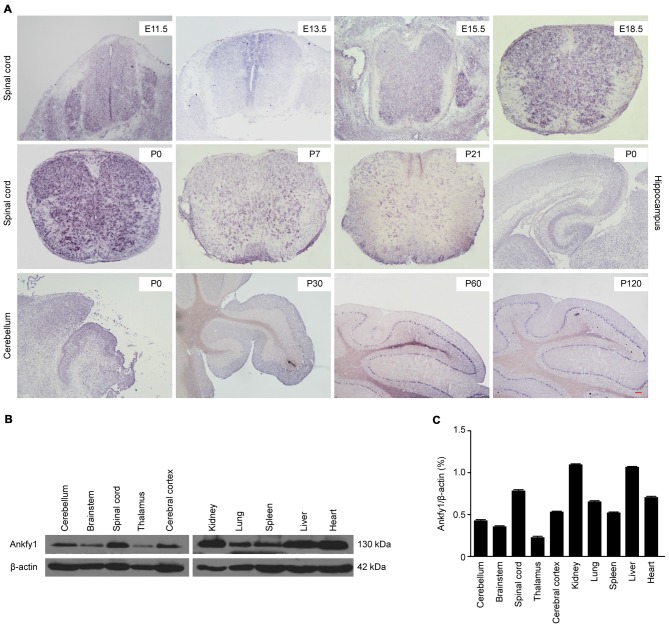
Figure 1.
Expression profiles of Ankfy1. (A) In situ hybridization studies confirm that Ankfy1 is expressed in the spinal cord (E11.5, E13.5, E15.5, E18.5, P0, P7 and P21), hippocampus (P0) and cerebellum (P0, P30, P60 and P120) of wild-type (WT) mice. The scale bar represents 200 μm. (B) Expression levels of the Ankfy1 protein in 10 adult mouse tissues were determined using western blotting. (C) Representative results are shown, and graphs present the ratio of Ankfy1 to β-actin. The data are presented as the means from three independent experiments.

