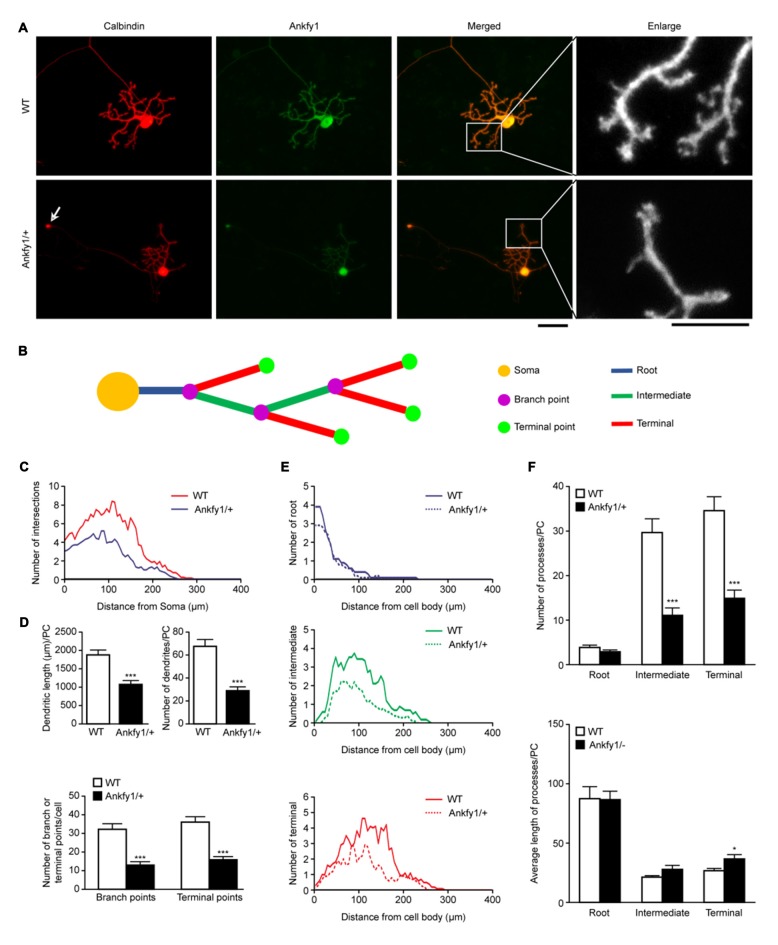
Figure 6.
Purkinje cell dendritic growth in WT and Ankfy1/+ cerebellar primary cell cultures. (A) Representative images of Purkinje cells in primary cell cultures at DIV14 stained by calbindin and Ankfy1 antibody. Arrows indicate the circular expansion of the axon in the Ankfy1/+ neuron. Cultures were photographed by microscopy for dendrite tracing. The scale bars represent 50 μm (left) and 25 μm (right). (B) Schematic of Sholl analysis showed parameters as in panel (A). (C) Total Sholl curves showed numbers of intersections of different distances from the Purkinje cell soma. Peak values positively correlated with dendritic density. (D) Quantitative analyses showed total dendritic length or amount and total branch or terminal point numbers per Purkinje cell (n = 10, ***p < 0.001). (E) Sholl analysis showed dendritic numbers within each process (root, intermediate and terminal) in WT and Ankfy1/+ cerebellar primary Purkinje cell cultures. Each curve area represented the average value of each process. (F) Average number and dendritic length of root, intermediate and terminal processes per cell (n = 10, *p < 0.05, ***p < 0.001). The data represent the means ± SEM.

