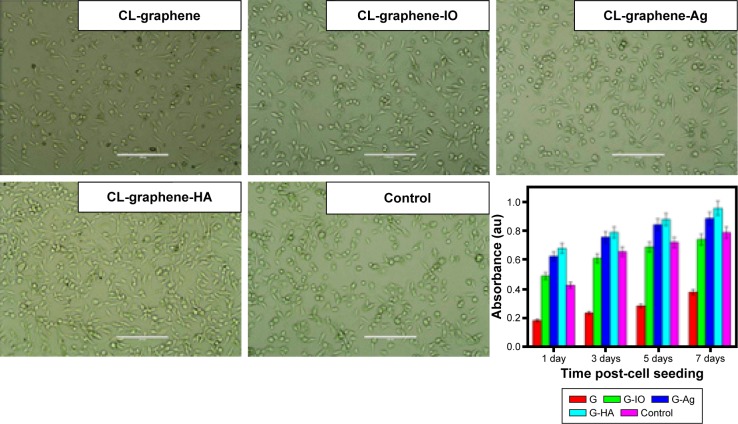
Figure 7.
Phase contrast micrographs of cell proliferation in the presence of different samples and their MTT assay showing the highest cell viability for G-HA. G-HA is statistically (P<0.01) greater than controls at all time points.
Note: Scale bar: 200 μm.
Abbreviations: MTT, 3-(4,5-dimethylthiazol-2-yl)-2,5-diphenyltetrazolium bromide; CL, collagen; Ag, silver; IO, iron oxide; HA, hydroxyapatite.

