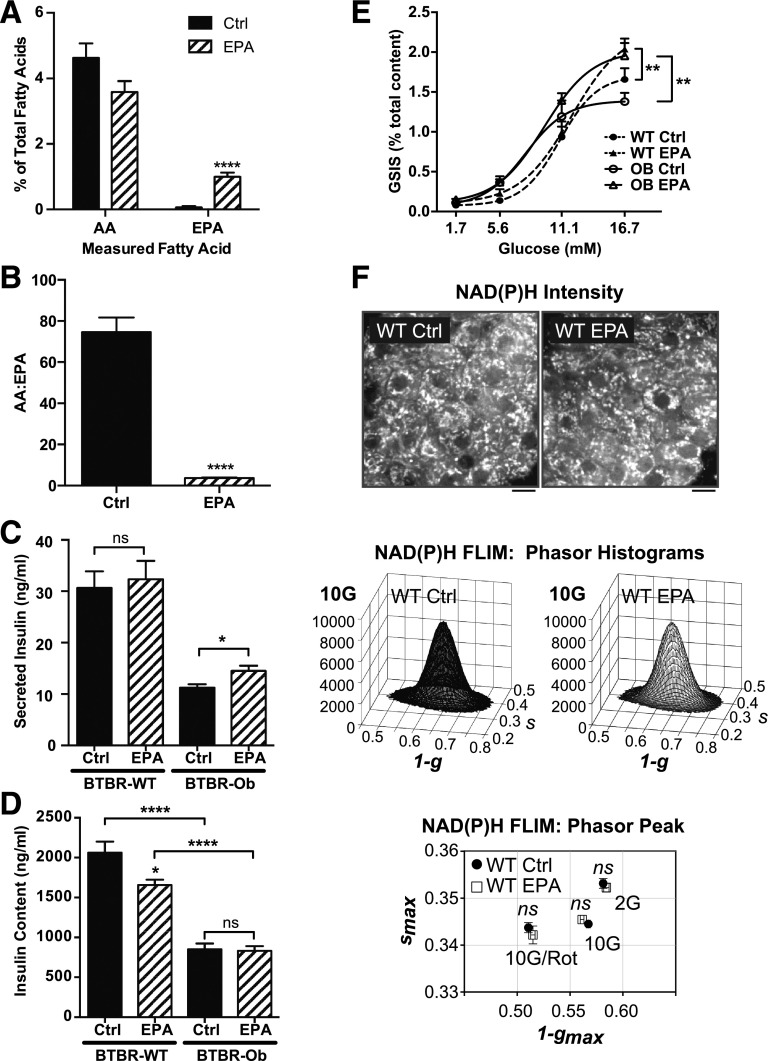
Figure 2.
Islet phospholipid AA and EPA composition can be altered ex vivo and impacts the GSIS response. A and B: Islets were incubated with BSA control (Ctrl) or 100 μmol/L EPA medium for 48 h before lipid extraction. AA and EPA are displayed as a percentage of total fatty acids (A) or the ratio between the two (B). Data were compared by unpaired t test within each species (n = 5–7). ****P < 0.0001. C: GSIS response of BTBR-WT or BTBR-Ob islets incubated with Ctrl or EPA medium. Data are represented as secreted insulin as a percentage of total content and compared by two-way ANOVA followed by a Sidak test post hoc (n = 4–6). *P < 0.05. D: Total islet insulin content from BTBR-WT and Ob islets treated with Ctrl or EPA-enriched medium. Data were compared by one-way ANOVA followed by a Tukey test post hoc (n = 4–6). *P < 0.05; ****P < 0.0001. E: GSIS response of BTBR-WT or BTBR-Ob islets incubated with Ctrl or EPA medium. Data are represented as secreted insulin as a percentage of total content and compared by two-way ANOVA followed by a Sidak test post hoc (n = 4–6). **P < 0.01. F: Islets isolated from BTBR-WT mice were incubated with BSA control or EPA-enriched medium for 48 h followed by multiphoton NAD(P)H-FLIM analysis. Representative intensity images are displayed above phasor histograms showing the frequency distribution of NAD(P)H lifetimes. Scale bars, 5 μm. The phasor histogram peaks (1 − gmax, smax) were plotted for control and EPA-treated islets in the presence of 2 mmol/L glucose (2G), 10 mmol/L glucose (10G), and 10 mmol/L glucose plus 5 μmol/L rotenone to inhibit Complex I (10G/Rot). Data were compared by one-way ANOVA followed by a Tukey test post hoc (n = 30–41 islets per condition from 4 animals each).

