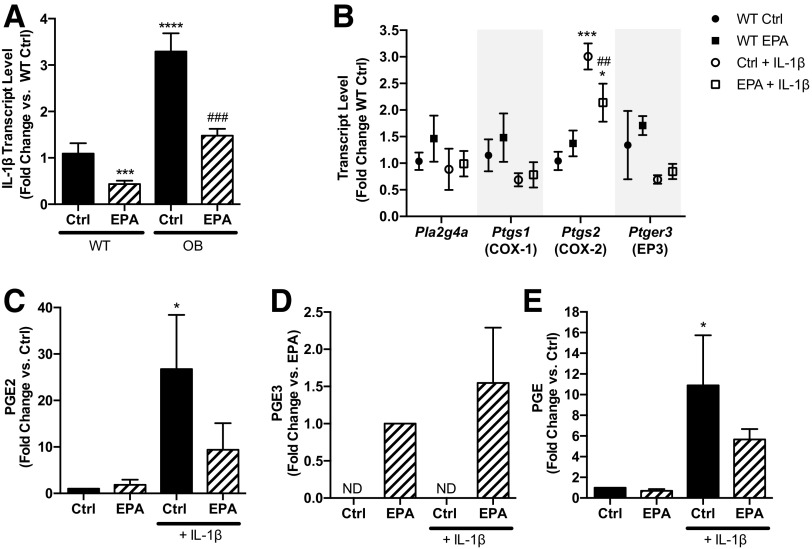
Figure 5.
IL-1β expression is correlated with Ptgs2 expression and PGE2 production in BTBR-Ob islets and can promote PGE2/PGE3 production from BTBR-WT islets. A: BTBR-WT and BTBR-Ob islets were incubated with BSA control (Ctrl) or 100 μmol/L EPA for 48 h, and islets were then snap frozen for gene expression analysis. Data were compared by one-way ANOVA with a Tukey posttest. N = 4 to 5; ***P < 0.001, ****P < 0.0001 compared with BTBR-WT Ctrl; ###P < 0.001 compared with BTBR-Ob Ctrl. B–E: BTBR-WT islets were incubated with BSA control or 100 μmol/L EPA for 48 h and then fresh medium containing 10 ng/mL IL-1β for 24 h. Islets were then snap frozen for gene expression analysis (B), and data were compared by one-way ANOVA with a Tukey posttest (n = 4). ND, not detected. *P < 0.05, ***P < 0.001 compared with WT Ctrl; ##P < 0.01 compared with Ctrl + IL-1β. Islet media was collected, snap frozen, and prostaglandin analysis was performed by LC/MS/MS (C and D) or ELISA (E). Data were compared by one-way ANOVA with a Dunnett posttest. N = 3 to 4. *P < 0.05 compared with BTBR-WT Ctrl.

