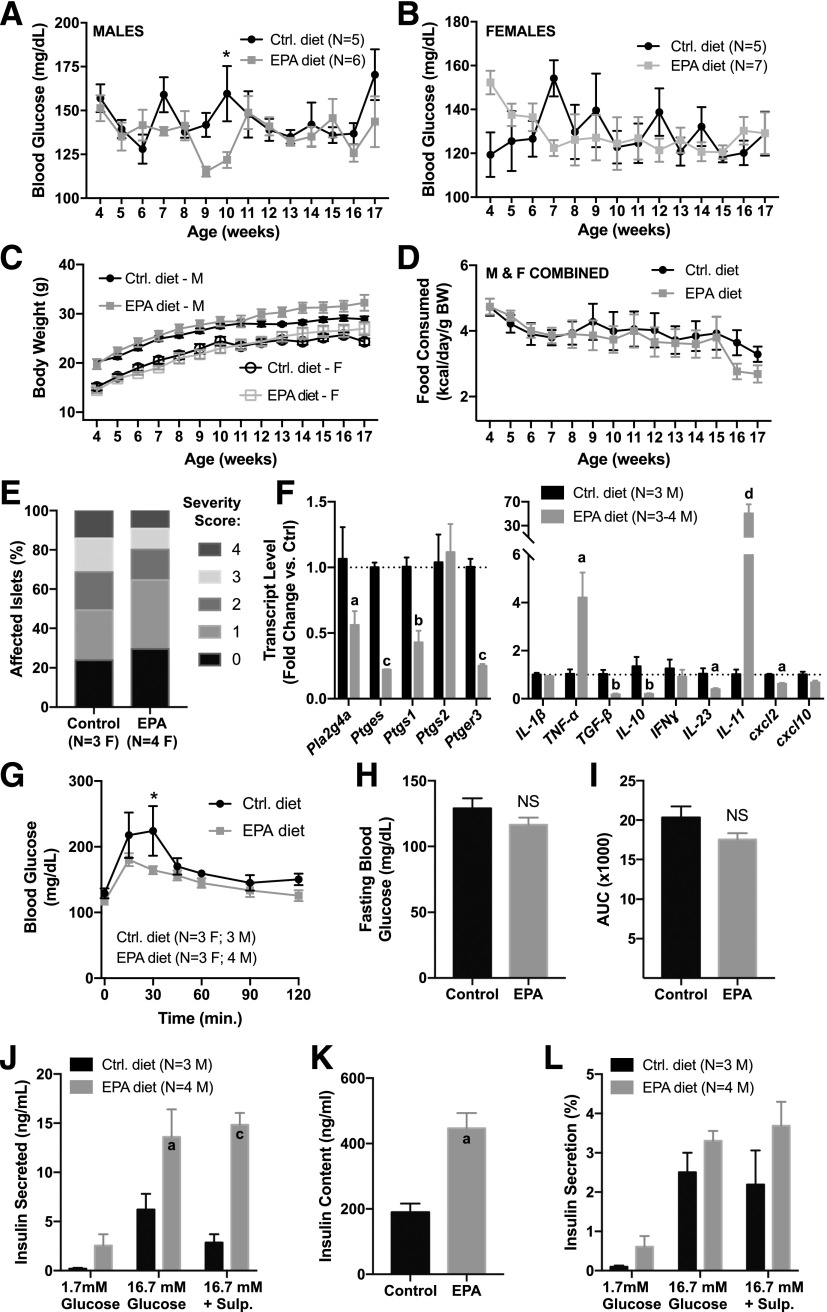
Figure 6.
A diet enriched in EPA improves glucose tolerance, gene expression profiles, and islet function in the NOD mouse. Male (M) and female (F) NOD mice were fed a diet enriched in EPA or a defined control diet from weaning until 17 weeks of age, and random-fed blood glucose (A and B), body weight (C), and food consumption (D) recorded weekly. Data were compared by two-way ANOVA with Sidak test post hoc. *P < 0.05. E: Pancreas sections from 17-week-old female NOD mice fed the control or EPA-enriched diet were stained with hematoxylin and eosin and analyzed to determine the percentage of islets in each of the islet inflammation scoring categories, in which 0 is no infiltration and 4 is completely infiltrated. F: Quantitative RT-PCR results for genes involved in prostaglandin production and signaling (left) and cytokines (right) in islets isolated from 17-week-old male NOD mice fed the control (Ctrl) or EPA-enriched diet. Fold change in gene expression was calculated using 2ΔΔCt, in which each biological replicate is normalized to the mean threshold cycle (Ct) value for β-actin. Significance was calculated for each gene using Student t test. aP < 0.05, bP < 0.01, cP < 0.001, dP < 0.0001 vs. control. G–I: Seventeen-week-old male and female mice were subjected to OGTT to 1 g/kg glucose. Glucose excursions (G), fasting blood glucose (H), and area under the curve (AUC; I) were recorded for each group. Data were compared by two-way ANOVA with Sidak test post hoc (G) or Student t test (H and I). *P < 0.05. Islets isolated from 17-week-old male NOD mice fed the control or EPA-enriched diet were subjected to in vitro analysis for total insulin secretion (J), insulin content (K), and insulin secreted as a percentage of total islet insulin content (L). Sulp., sulprostone. Significance was calculated by two-way ANOVA with Sidak test post hoc. aP < 0.05, cP < 0.001 vs. the appropriate control.

