Figure 1.
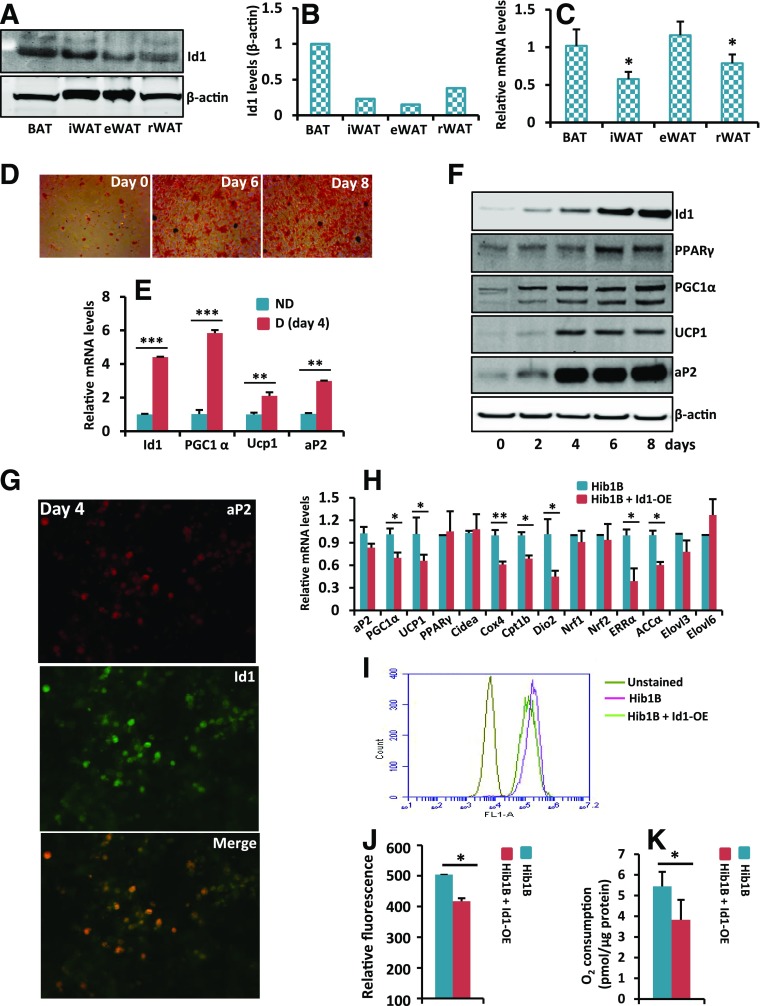
Id1 expression is induced during brown adipocyte differentiation in HIB1B cells. A and B: Expression levels of Id1 and β-actin in various adipose tissues of 2-month-old C57BL/6J mice (A). After acquiring images, band intensities were measured and normalized to β-actin by the Li-Cor Odyssey system (B). C: Id1 mRNA transcript levels in various adipose tissues of 2-month-old C57BL/6J mice. Compared with BAT or eWAT, Id1 expression level is lower in iWAT and rWAT (n = 3). D: Oil Red O staining of nondifferentiated (day 0) and day 6 and day 8 differentiated HIB1B brown preadipocyte cells. E: Id1, aP2, PGC1α, and Ucp1 mRNA transcript levels in day 4 differentiated (D) HIB1B cells compared with nondifferentiated (ND) cells (n = 3). F: The expression patterns of Id1, PPARγ, PGC1α, UCP1, aP2, and β-actin during HIB1B brown adipocyte differentiation at the indicated time points. G: Immunofluorescence costaining of aP2 and Id1 on day 4 differentiated HIB1B cells showing strong expression of Id1 in aP2-positive cells. Original magnification ×20. H: Relative mRNA transcript levels of indicated genes in control and Id1-OE nondifferentiated HIB1B cells (n = 3). I: FACS analysis of unstained and nonyl acridine orange–stained control and Id1-OE nondifferentiated HIB1B cells. J: The relative fluorescence level (FL) of nonyl acridine orange in control and Id1-OE cells (n = 3). K: VO2 rate of control and Id1-OE nondifferentiated HIB1B cells (n = 4). Data are mean ± SD. *P < 0.05; **P < 0.005; ***P < 0.0005.

