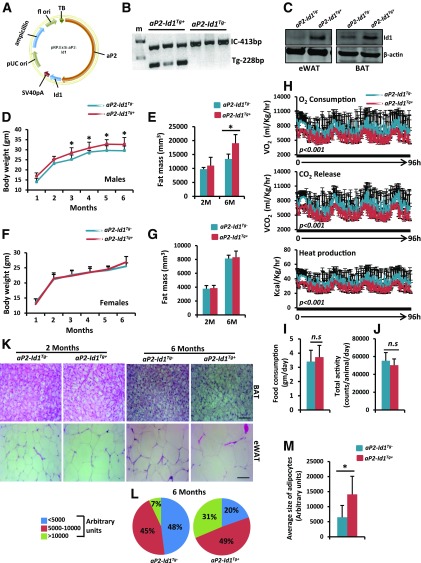
Figure 2.
Adipose tissue–specific overexpression of Id1 reduces energy expenditure. A: The aP2-Id1 expression vector used to generate adipose tissue–specific aP2-Id1Tg+ transgenic mice. f1 ori, f1 single-strand RNA origin; pUC ori, pUC origin; TB, transcription blocker. B: Gel photograph showing the PCR bands of internal control (IC) (β-actin) and Id1 transgene. C: Expression levels of Id1 protein and β-actin in the eWAT and BAT of aP2-Id1Tg− control and aP2-Id1Tg+ mice. D: Body weight of male aP2-Id1Tg− and aP2-Id1Tg+ mice (n = 8–10) at the indicated time points. E: Fat mass density in 2- and 6-month-old aP2-Id1Tg− and aP2-Id1Tg+ male mice measured by multislice computed tomography scanner (n = 5–6). F: Body weight of female aP2-Id1Tg− and aP2-Id1Tg+ mice (n = 8–10) at the indicated time points. G: Fat mass density in 2- and 6-month-old aP2-Id1Tg− and aP2-Id1Tg+ female mice measured by multislice computed tomography scanner (n = 5). Data are mean ± SD. H–J: VO2 rate, VCO2, and heat production (H); food consumption (I); and physical activity (J) in aP2-Id1Tg− and aP2-Id1Tg+ male mice measured for 4 days with Oxymax/CLAMS (n = 5–6). K: Representative hematoxylin-eosin–stained BAT and eWAT sections. Scale bars = 10 μm. L and M: Adipocyte size distribution (L) and the average size of adipocytes (M) in the eWAT of 6-month-old aP2-Id1Tg− and aP2-Id1Tg+ male mice. Data are mean ± SD. *P < 0.05. bp, base pair; M, month; n.s, not significant.

