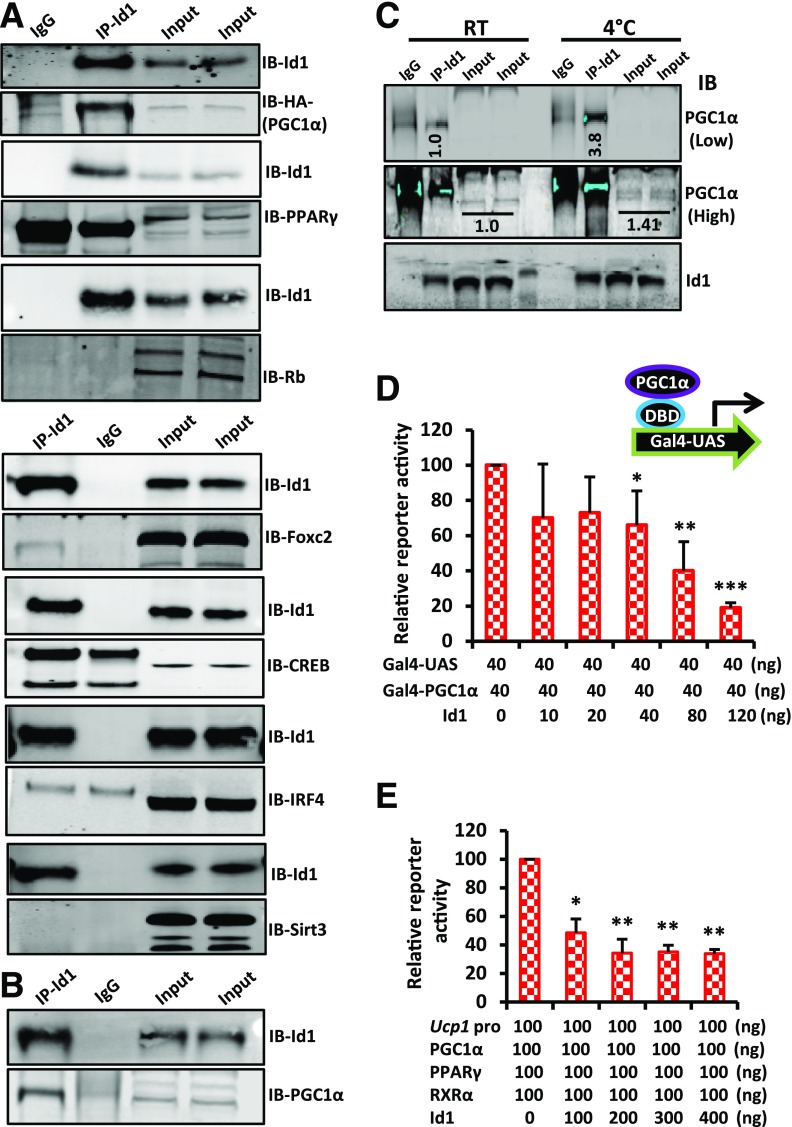
Figure 5.
Id1 suppresses PGC1α transcriptional activity. A: Co-IP followed by Western blot showing a direct interaction between Id1 and PGC1α (HA tag), whereas Id1 did not directly interact with other proteins tested. Input: 2% of IP reaction. B: Co-IP followed by Western blot showing a direct interaction between endogenous Id1 and PGC1α in day 6 differentiated HIB1B cells. Input: 5% of IP reaction. C: Co-IP followed by Western blot showing a direct interaction between endogenous Id1 and PGC1α in the BAT of mice at RT and after exposure to 4°C for 4 h. Input: 5% of IP reaction. The higher-exposure image also was included to show PGC1α input bands not visible under lower exposure. Band intensities were measured and normalized to PGC1α input bands by the Li-Cor Odyssey system. D: Transcriptional activity of PGC1α was assayed by cotransfecting Cos-7 cells with luciferase reporter driven by Gal-UAS and Gal4-PGC1α plasmid (full-length PGC1α fused with the DBD of yeast Gal4) with various concentrations of the Id1 expression vector (n = 3). E: Transcriptional activity of PGC1α was assayed by cotransfecting Cos-7 cells with luciferase reporter driven by Ucp1 promoter, PPARγ, RXRα (PPARγ binding partner), and various concentrations of Id1 plasmid (n = 2). Data are mean ± SD. *P < 0.05; **P < 0.005; ***P < 0.0005. IB, immunoblot.

