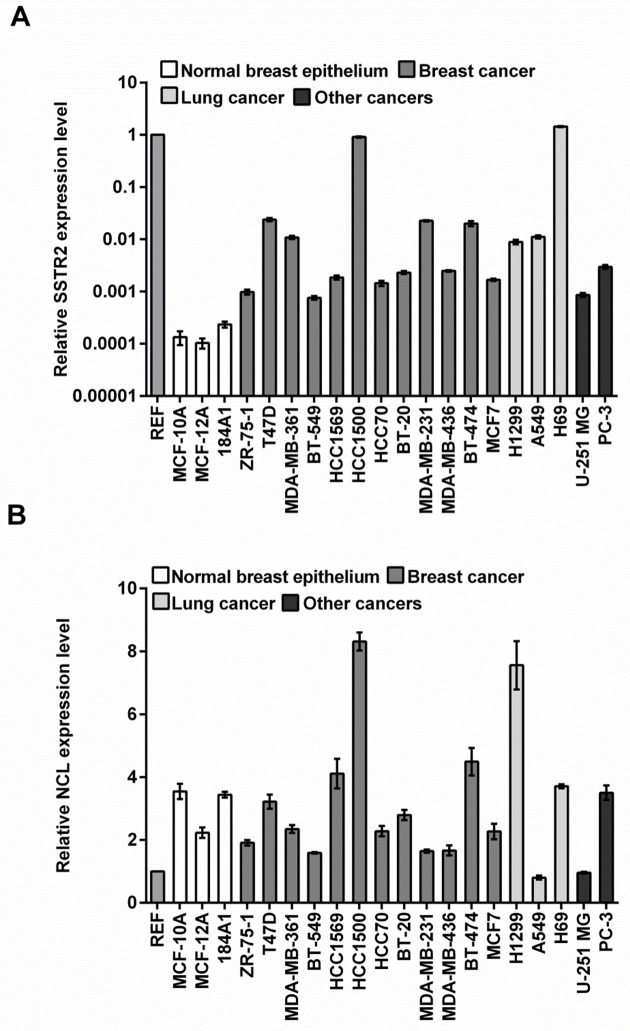
Fig 1. Real-Time PCR quantification of mRNA.
Real-time PCR showing relative expression levels of SSTR2 (A) and NCL (B) in a panel of human cell lines displayed on a logarithmic and a non-logarithmic scale, respectively. Expression levels were normalized to GAPDH and ACTB as housekeeping genes. We defined a common reference value (REF; see Materials and methods), to allow for comparison of expression levels between the two genes. The average level and SEM for each cell line were calculated from three wells.

