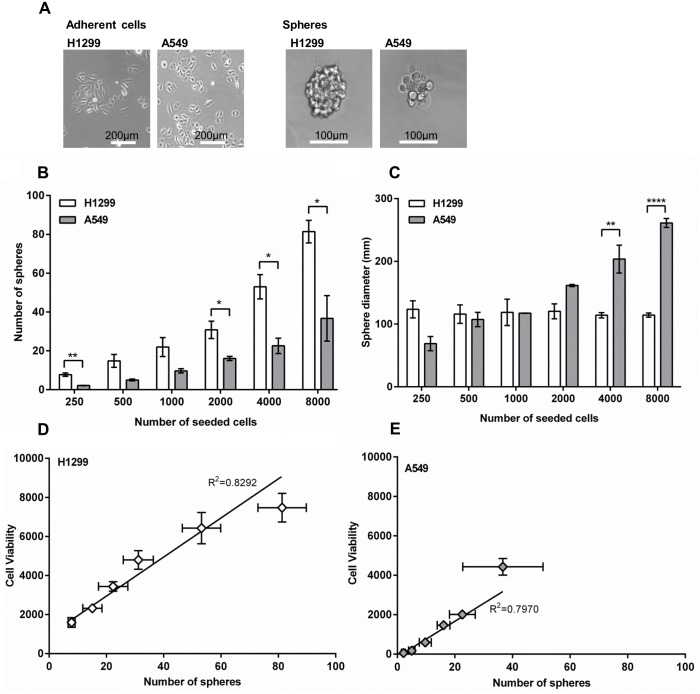
Fig 3. Sphere formation capacity.
(A) The two NSCLC cell lines H1299 and A549 were grown as adherent cells or spheres for six days. (B) The number of lung cancer spheres after six days at different number of seeded cells. Mean and SEM from 3–4 plates. (C) Diameter of A549 and H1299 lung cancer spheres. Mean and SEM of 3–4 plates. The number of H1299 spheres (D) and A549 spheres (E) correlated with cell viability. SEM for sphere count and cell viability from 3–4 plates plotted as vertical and horizontal error lines, respectively. T-test depicts difference between A549 and H1299 at identical number og seeded cells p-value <0.05; *, <0.01; **; <0.0001; ****.

