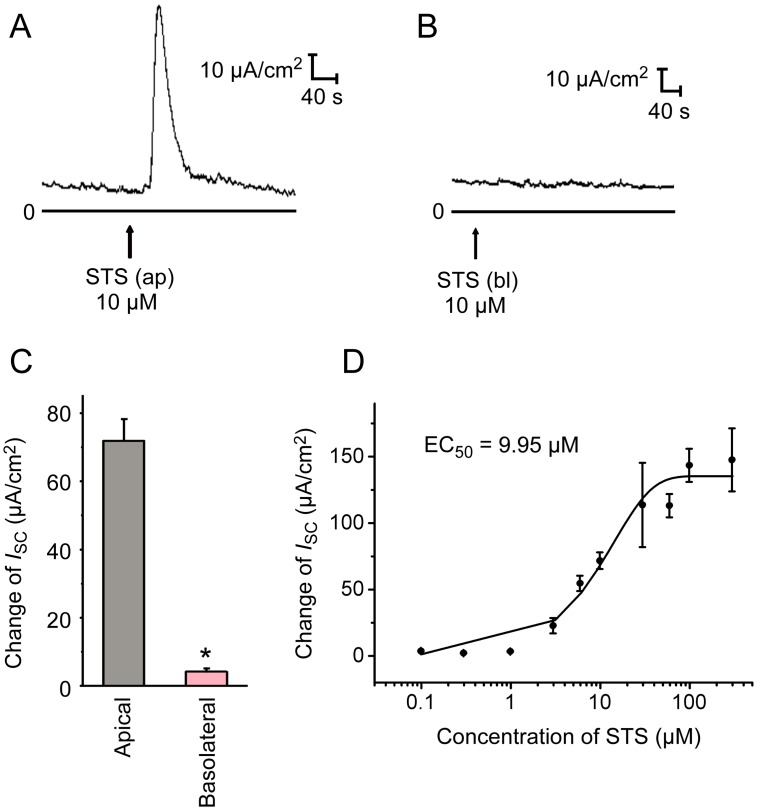
Fig 2. Effect of STS on Isc response in mouse tracheal epithelium.
(A) Apical application (ap) of 10 μM STS induced a fast and transient increase in Isc, as visible in the typical current trace. (B) Typical Isc response of basolateral application (bl) of 10 μM STS in normal K-H solution. (C) Comparison of ΔIsc induced by STS in apical (n = 9) and basolateral (n = 5) in mouse tracheal epithelium. Values are mean ± S.E.M. (Student’s t-test, *P < 0.05 compared with the apical group). (D) Dose-response curve of the apical application of STS-induced changes on Isc. The concentrations of STS are 0.1, 0.3, 1, 3, 6, 10, 30, 60, 100 and 300 μM. Each data point is mean ± S.E.M. (n = 3–6). EC50: effective concentration for half-maximal ΔIsc after apical STS application. The arrows mark the time at which the drugs were added.

