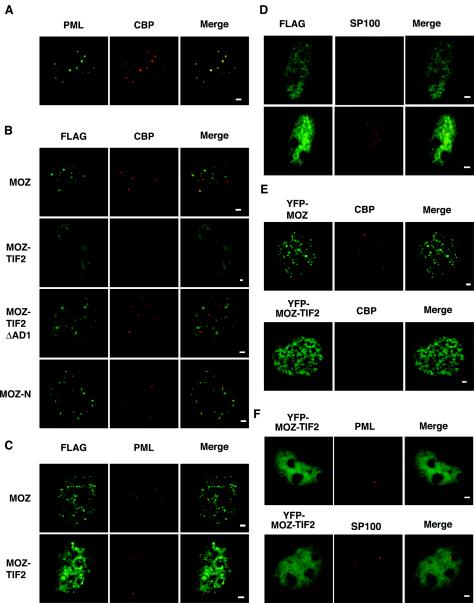
FIG. 5.
Subcellular localization of MOZ, MOZ-TIF2, MOZ-N, and MOZ-TIF2ΔAD1 and their effect on the nuclear distribution of endogenous CBP and PML in COS-1 cells. (A) Staining of COS-1 cells for endogenous CBP and PML. (B) Detection of the indicated FLAG-MOZ fusion proteins and endogenous CBP. (C) Costaining of FLAG-tagged MOZ proteins with endogenous PML. (D) Costaining of FLAG-MOZ-TIF2 for endogenous SP100. (E) Detection of YFP-MOZ and YFP-MOZ-TIF2 proteins with staining for endogenous CBP. (F) Staining of cells expressing YFP-MOZ-TIF2 for endogenous PML. Red and green channels are shown in the Merge panels; yellow indicates colocalization. Bar, 1 μm.

