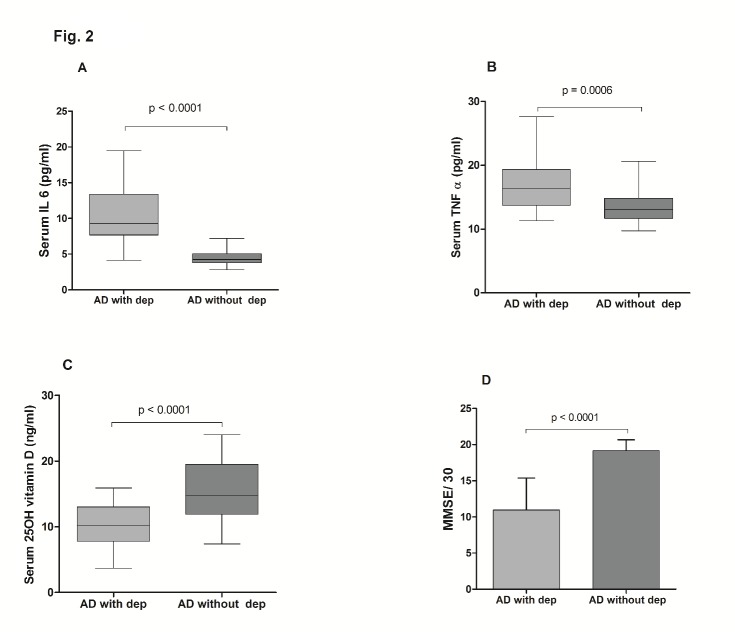
Figure 2. Serum levels of IL 6, TNF α, 25-hydroxyvitamin D (25OH vitamin D) and MMSE in AD subjects with depression (AD with dep) and without depression (AD without dep).
Box and Whisker plots represent median, upper median, lower median, and minimum to maximum range of serum IL 6 (A), TNF α (B) and 25-hydroxyvitamin D (C) while Bar diagram represents mean MMSE (D) among AD subjects with and without depression. Values expressed as the means ± SD are: IL 6 (pg/ml) 10.47±4.18 (AD with depression), 4.56±1.20 (AD without depression); TNFα (pg/ml) 16.84±3.88 (AD with depression), 13.48±2.92 (AD without depression); 25-hydroxyvitamin D (ng/ml) 10.22 ± 3.22 (AD with depression), 15.61 ± 4.64 (AD without depression); MMSE 10.9±4.38 (AD with depression), 19.15±1.46 (AD without depression). Statistically significant difference, p < 0.001, AD subjects with depression versus AD subjects without depression.

