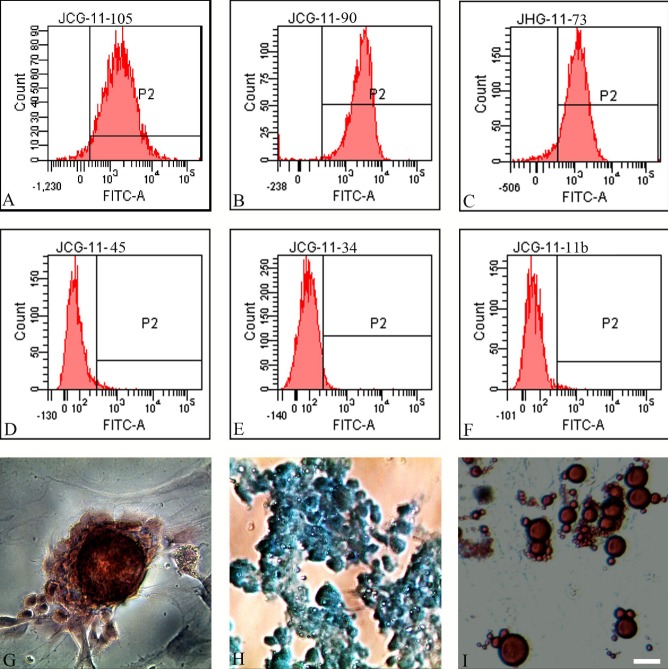
Figure 1. Characterization of BMSCs.
BMSCs were analyzed by flow cytometry for the stromal markers - CD105 (99.0%) (A), CD90 (98.5%) (B), and CD73 (96.4%) (C), and hematopoietic markers - CD45 (2.2%) (D), CD34 (0.6%) (E) and CD11b (3.6%) (F). After BMSCs were induced for Osteogenesis (3 weeks), Chondrogenesis (2 weeks), and Adipogenesis (2 weeks) using differentiation Kits, alizarin red, alcian blue and oil red O staining visualized osteoblasts (G) (red), chondroblasts (H) (blue) and adipocytes (I) (red), respectively. Bar = 20μm.

