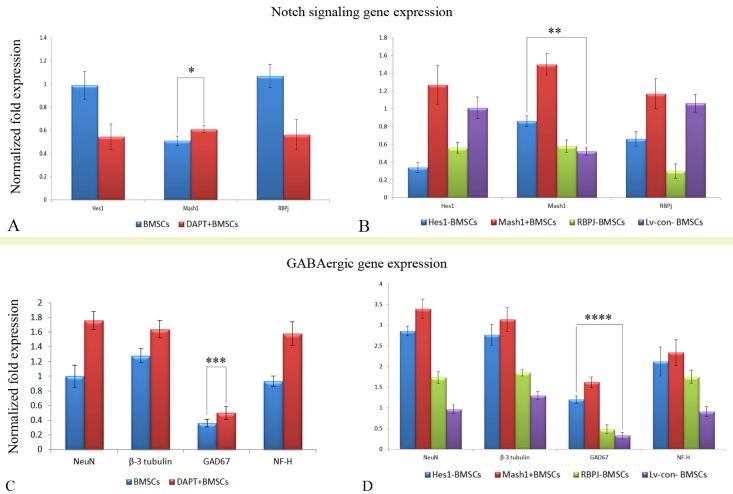
Figure 3. RNA level of Notch signaling and GABA-ergic gene expression in different cell samples.
A) Notch signaling gene expression in DAPT+ BMSCs. B) Following induction through the cocktail conditioned medium, RNA levels are shown for the neuronal and GABAergic differentiation of the DAPT+ BMSCs. C) Notch signaling gene expression in genetically engineered BMSCs. D) RNA levels are shown for genetically engineered BMSCs induced by the cocktail conditioned medium. *P = 0.027, < 0.05, **P = 0.0009, < 0.01, ***P = 0.036, < 0.05, ****P = 7.80872E-06, < 0.01.

