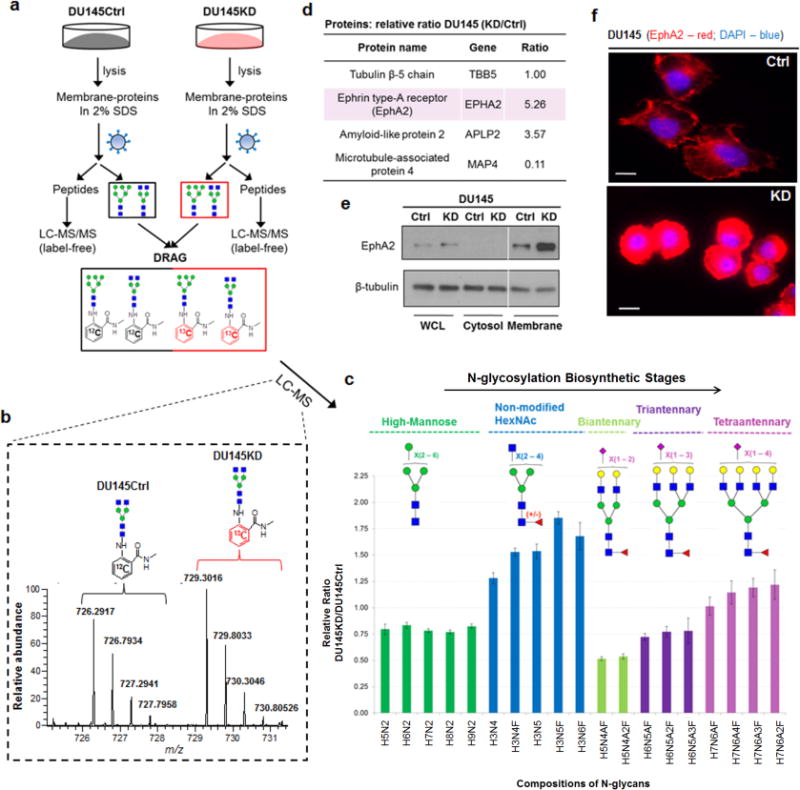
FIG. 3.

(a) SRS was employed to quantitatively compare the proteome and N-glycome of DIAPH3-silenced (amoeboid, DU145KD) and non-silenced (control, DU145Ctrl) human prostate cancer cell lines. Released N-glycans were compared by LC-MS utilizing a pair of light and heavy isotopes incorporated tags with a 6 Da mass difference (DRAG)(8). Proteins were quantitatively compared by spectral counting. (b) A representative LC-MS spectrum used to calculate the relative ratio of the same N-glycan species (Hex3HexNAc4) identified in both cell lines. (c) Distinct quantitative ratios were determined among five specific N-glycan subgroups: high-mannose (green), complex-type with unmodified non-reducing end HexNAc (blue), biantennary with terminal sialic acid (light green), triantennary with terminal sialic acid (purple), and tetraantennary with terminal sialic acid (pink). All putative topologies were proposed based on the mammalian N-glycosylation biosynthetic pathway and their m/z values (<10 ppm). Selected compositions were further manually validated by MS/MS fragmentations. H: hexose; N: N-acetylhexosamine; A: N-acetylneuraminic acid (Neu5Ac); F: fucose. (d) Differential expression of selected proteins identified by SRS from DU145Ctrl and DU145KD cell lines. Additional validation of EphA2 expression differences by immunoblotting (e), and immunofluorescence (f). Scale bar, 10μm.
