
Figure 5.
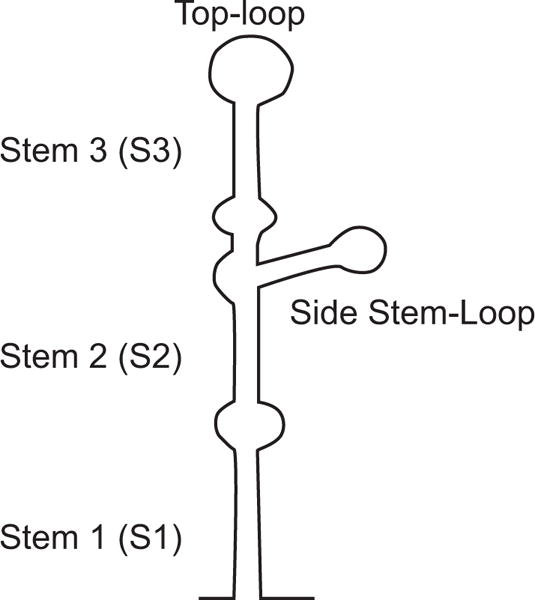
Schematic representation of the 5′ stem loop structure of flavivirus genomes. The regions corresponding to the predicted secondary structures stem 1 (S1), stem 2 (S2), stem 3 (S3), top loop, and side stem loop are indicated.
Official websites use .gov
A
.gov website belongs to an official
government organization in the United States.
Secure .gov websites use HTTPS
A lock (
) or https:// means you've safely
connected to the .gov website. Share sensitive
information only on official, secure websites.
Schematic representation of the 5′ stem loop structure of flavivirus genomes. The regions corresponding to the predicted secondary structures stem 1 (S1), stem 2 (S2), stem 3 (S3), top loop, and side stem loop are indicated.