
Figure 2.
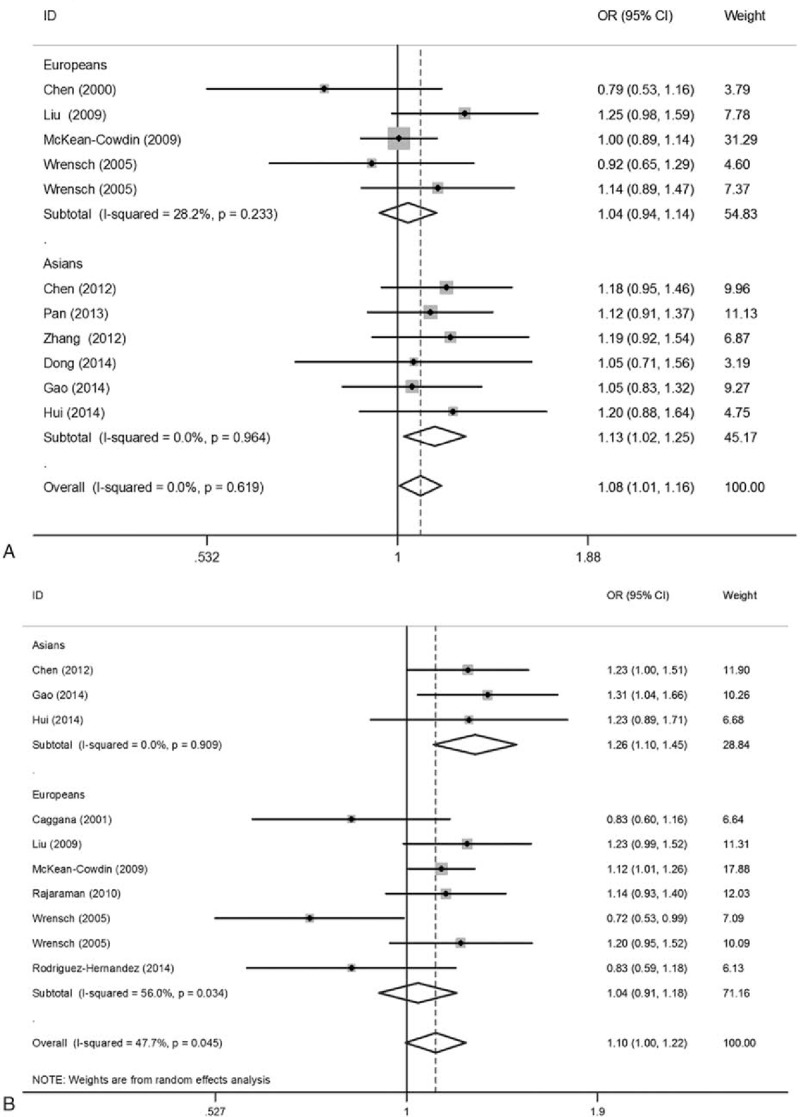
Forest plots for the association between theERCC1 rs3212986 and ERCC2 rs13181 polymorphisms and glioma risk. (A) ERCC1 rs3212986 polymorphism (A vs C); (B) ERCC2 rs13181 polymorphism (C vs A). The sizes of the squares reflect the weighting of included studies; the center of diamonds reflect summary effect, the left and right extremes of diamonds reflect 95% confidence intervals. CI = confidence interval, OR = odds ratio.