
Figure 3.
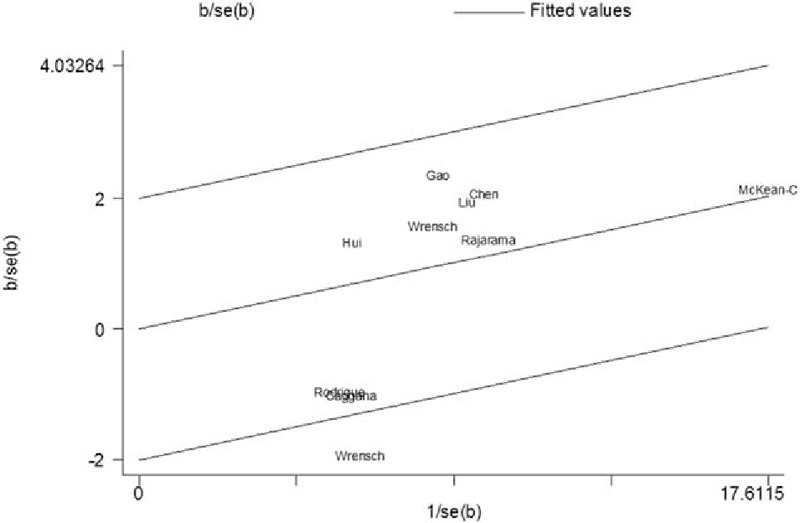
Galbraith plots of ERCC2 rs13181 polymorphism and glioma risk. The regression runs through the origin interval (central solid line). The 95% confidence interval is between the 2 outer parallel lines at 2 units above and below the regression line. One study (Wrensch et al[41]) was the outlier.